Operational Dashboards for Complex Systems
This collection brings together visualization work for operational monitoring, dispatch, and risk warning. Across different domains, the challenge is consistent: organize dense information within limited screen space so users can understand the whole, locate anomalies, and move into specific objects and tasks. My scope varied by project and included information architecture, interface and visual design, design standards, and engineering delivery.

Datang Inner Mongolia Production Operations Center
A command-center dashboard presenting production overview, regional operations, equipment status, and key metrics on ultra-wide displays.
A hierarchy from overview to region, equipment, and metrics supports continuous monitoring and rapid drill-down.
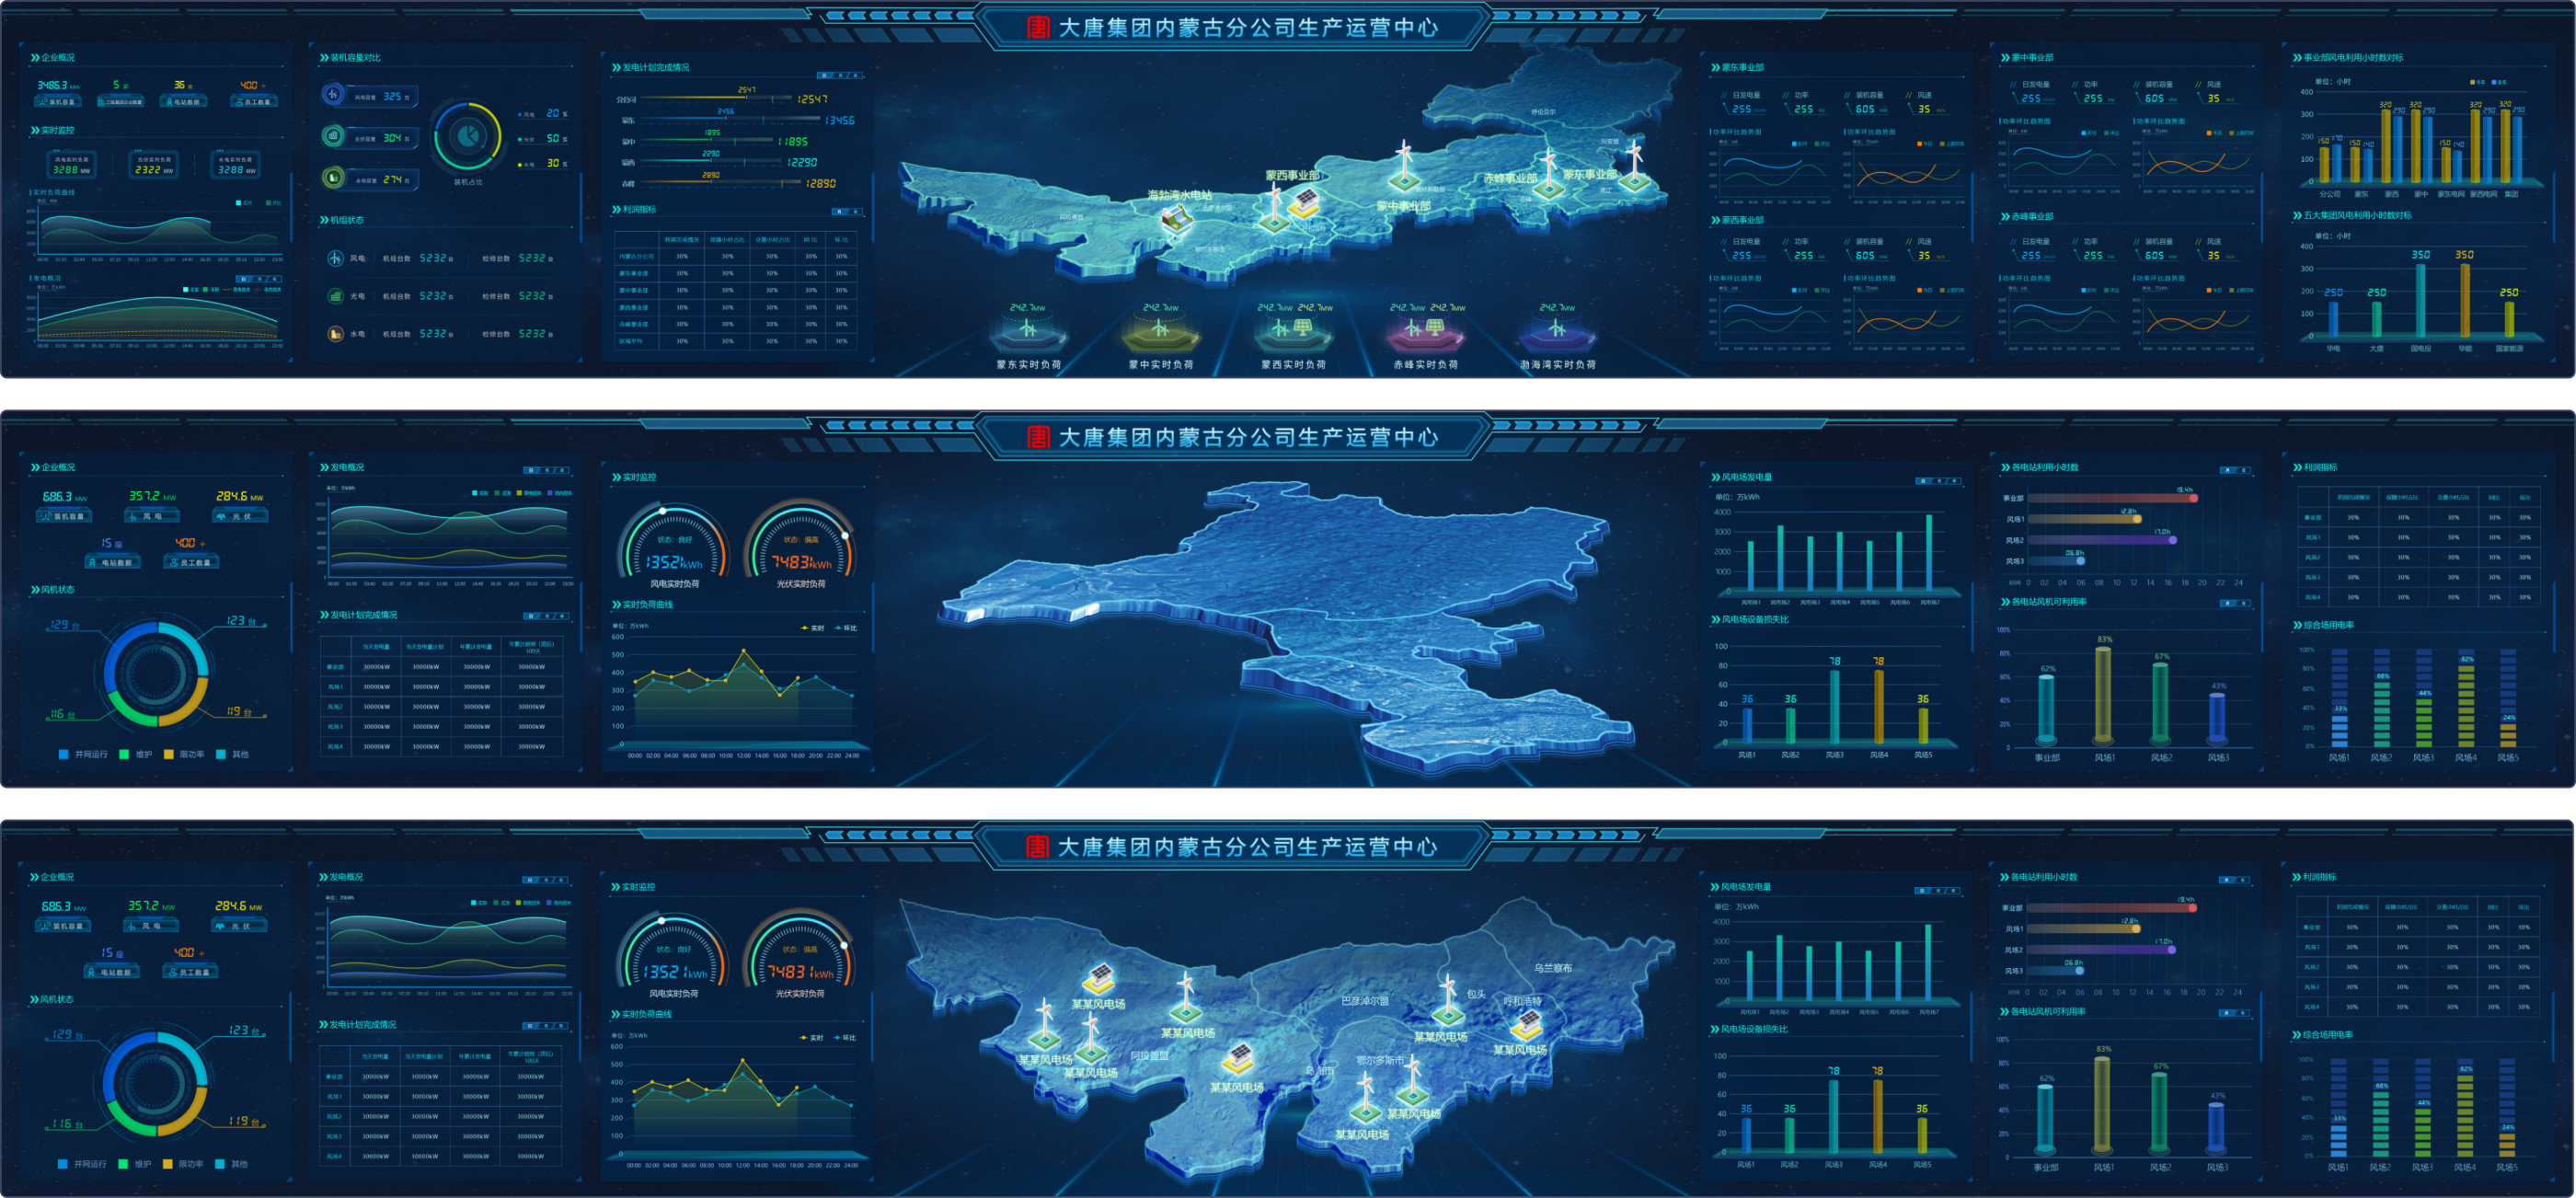
Datang Inner Mongolia Production Operations Center
A command-center dashboard presenting production overview, regional operations, equipment status, and key metrics on ultra-wide displays.
A hierarchy from overview to region, equipment, and metrics supports continuous monitoring and rapid drill-down.
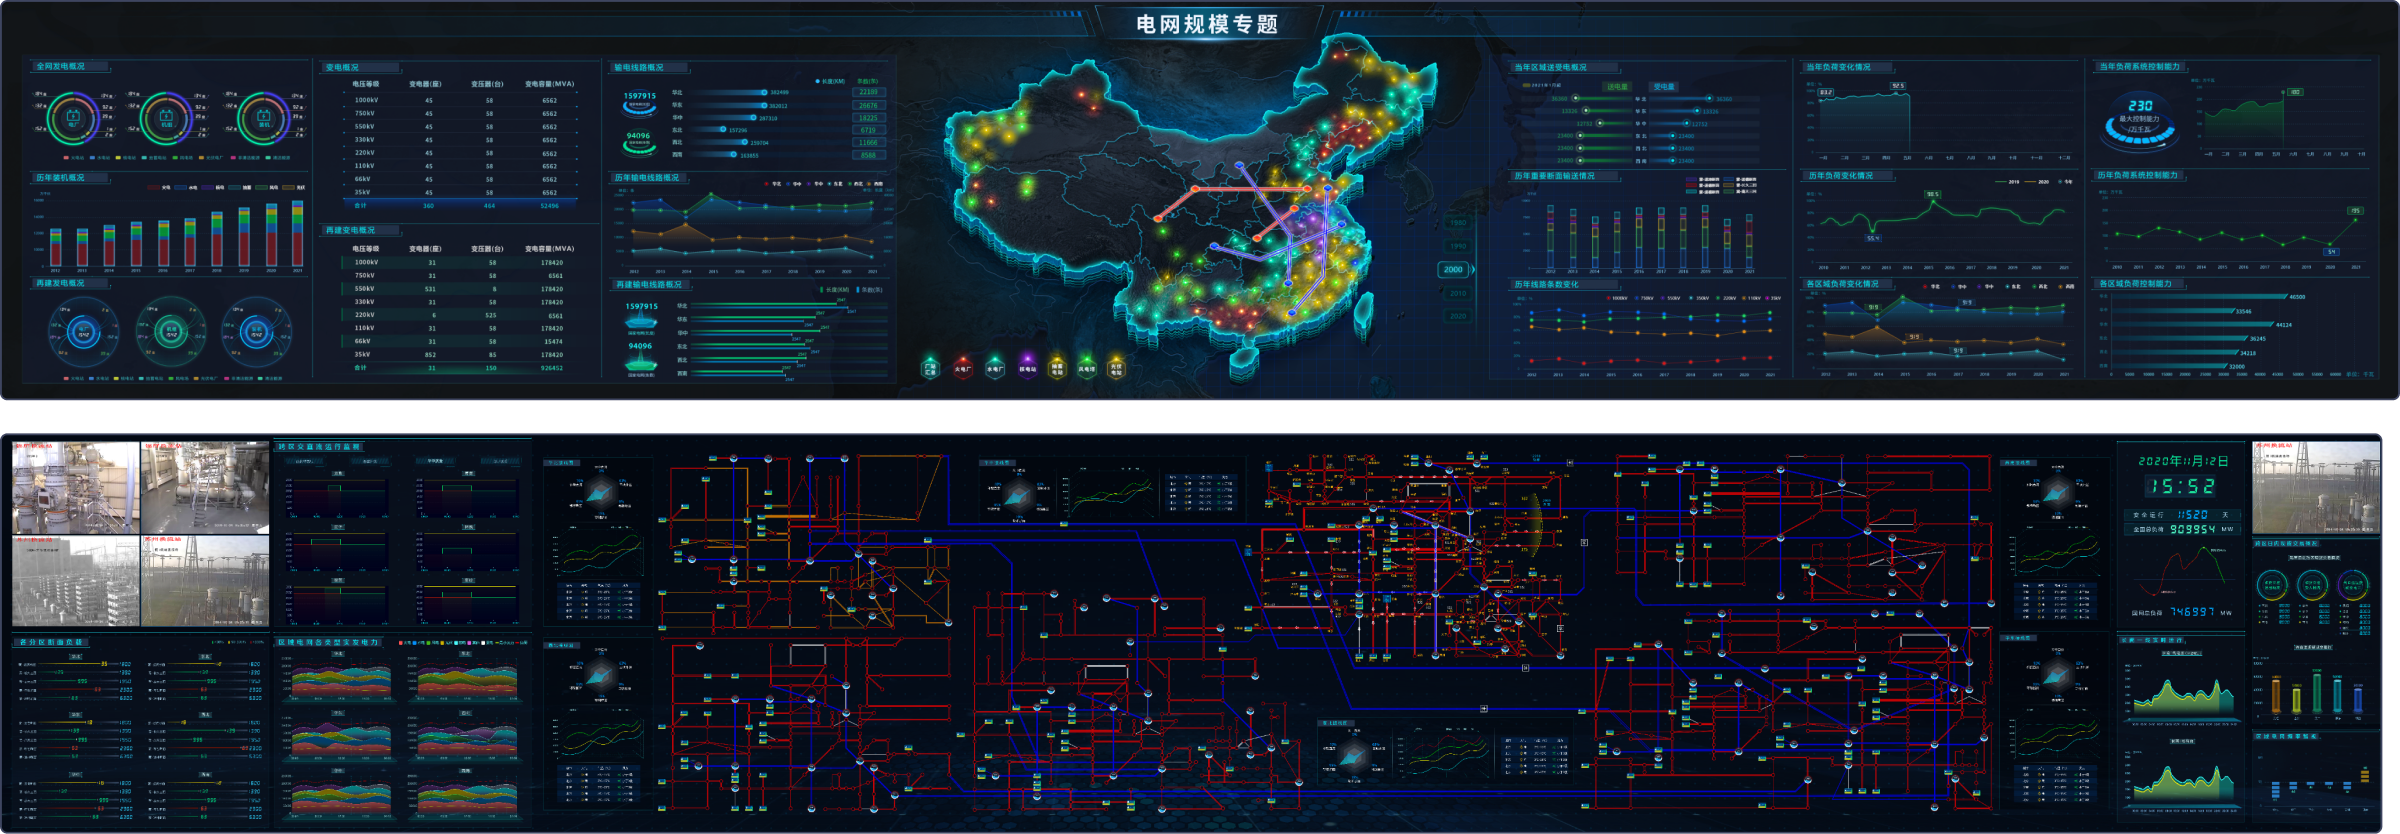
Power Grid Operations Overview
Shows national and priority-region conditions through grid distribution, capacity, load, trends, and key events.
Regional and network relationships organize scale metrics, trends, and events into a progressive reading structure.
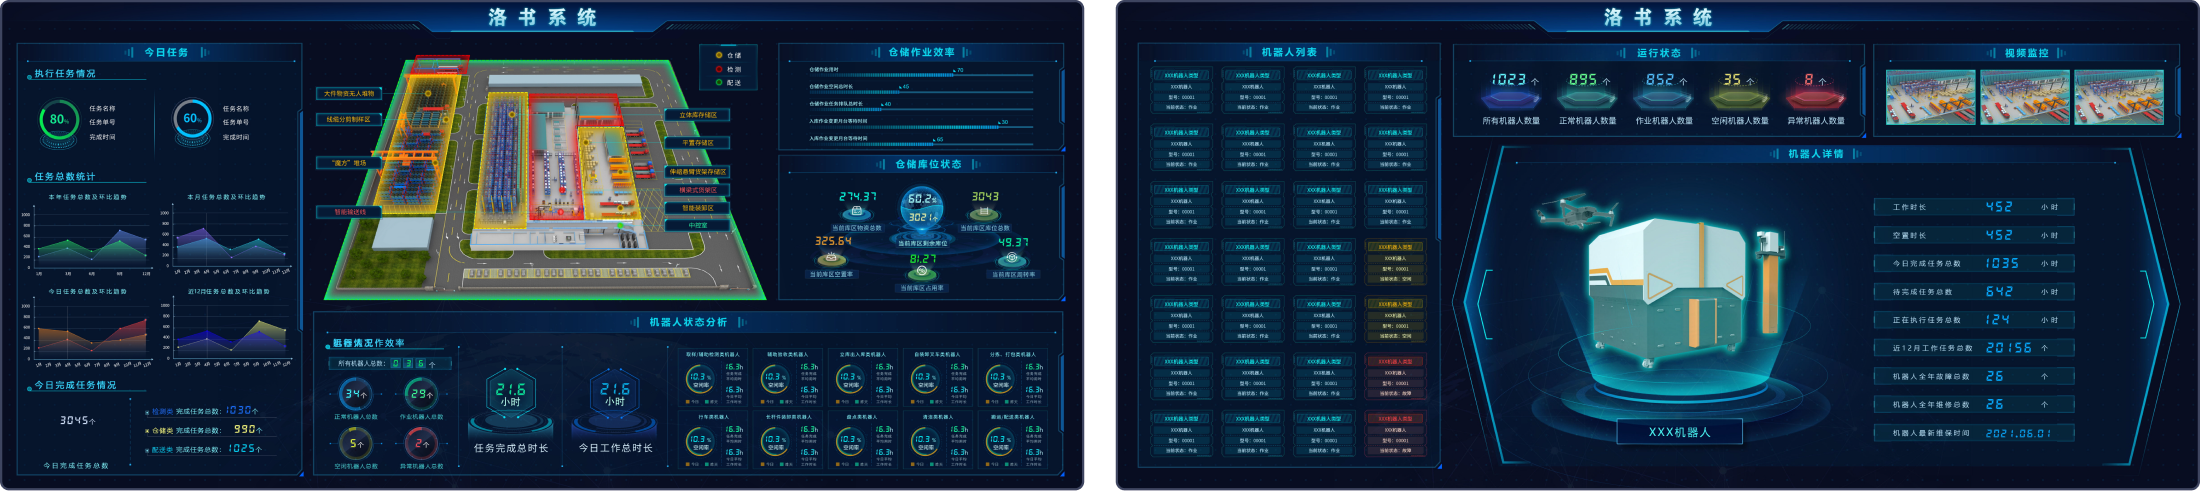
Luoshu Equipment Intelligence System
Combines regional layout, equipment status, analysis results, and trends for continuous operational monitoring.
Spatial layout locates equipment while status and trends explain change, linking overview and object detail.
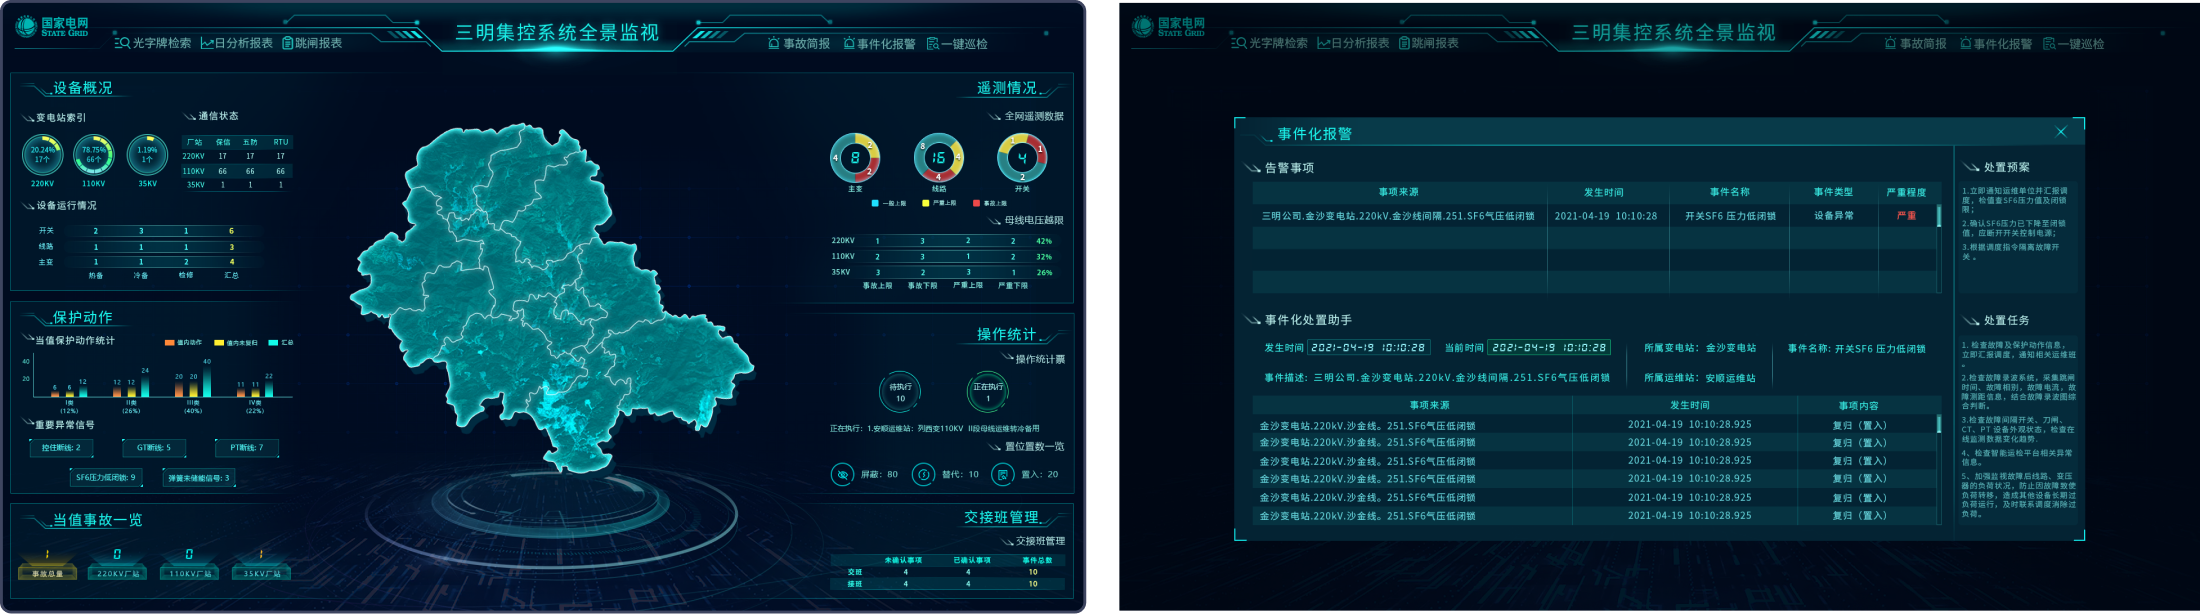
Sanming Centralized Control Panorama
A regional map shows where monitored objects are located, while structured lists support search and status checks.
The map provides spatial orientation; lists support object-level verification and connect regional conditions to device status.
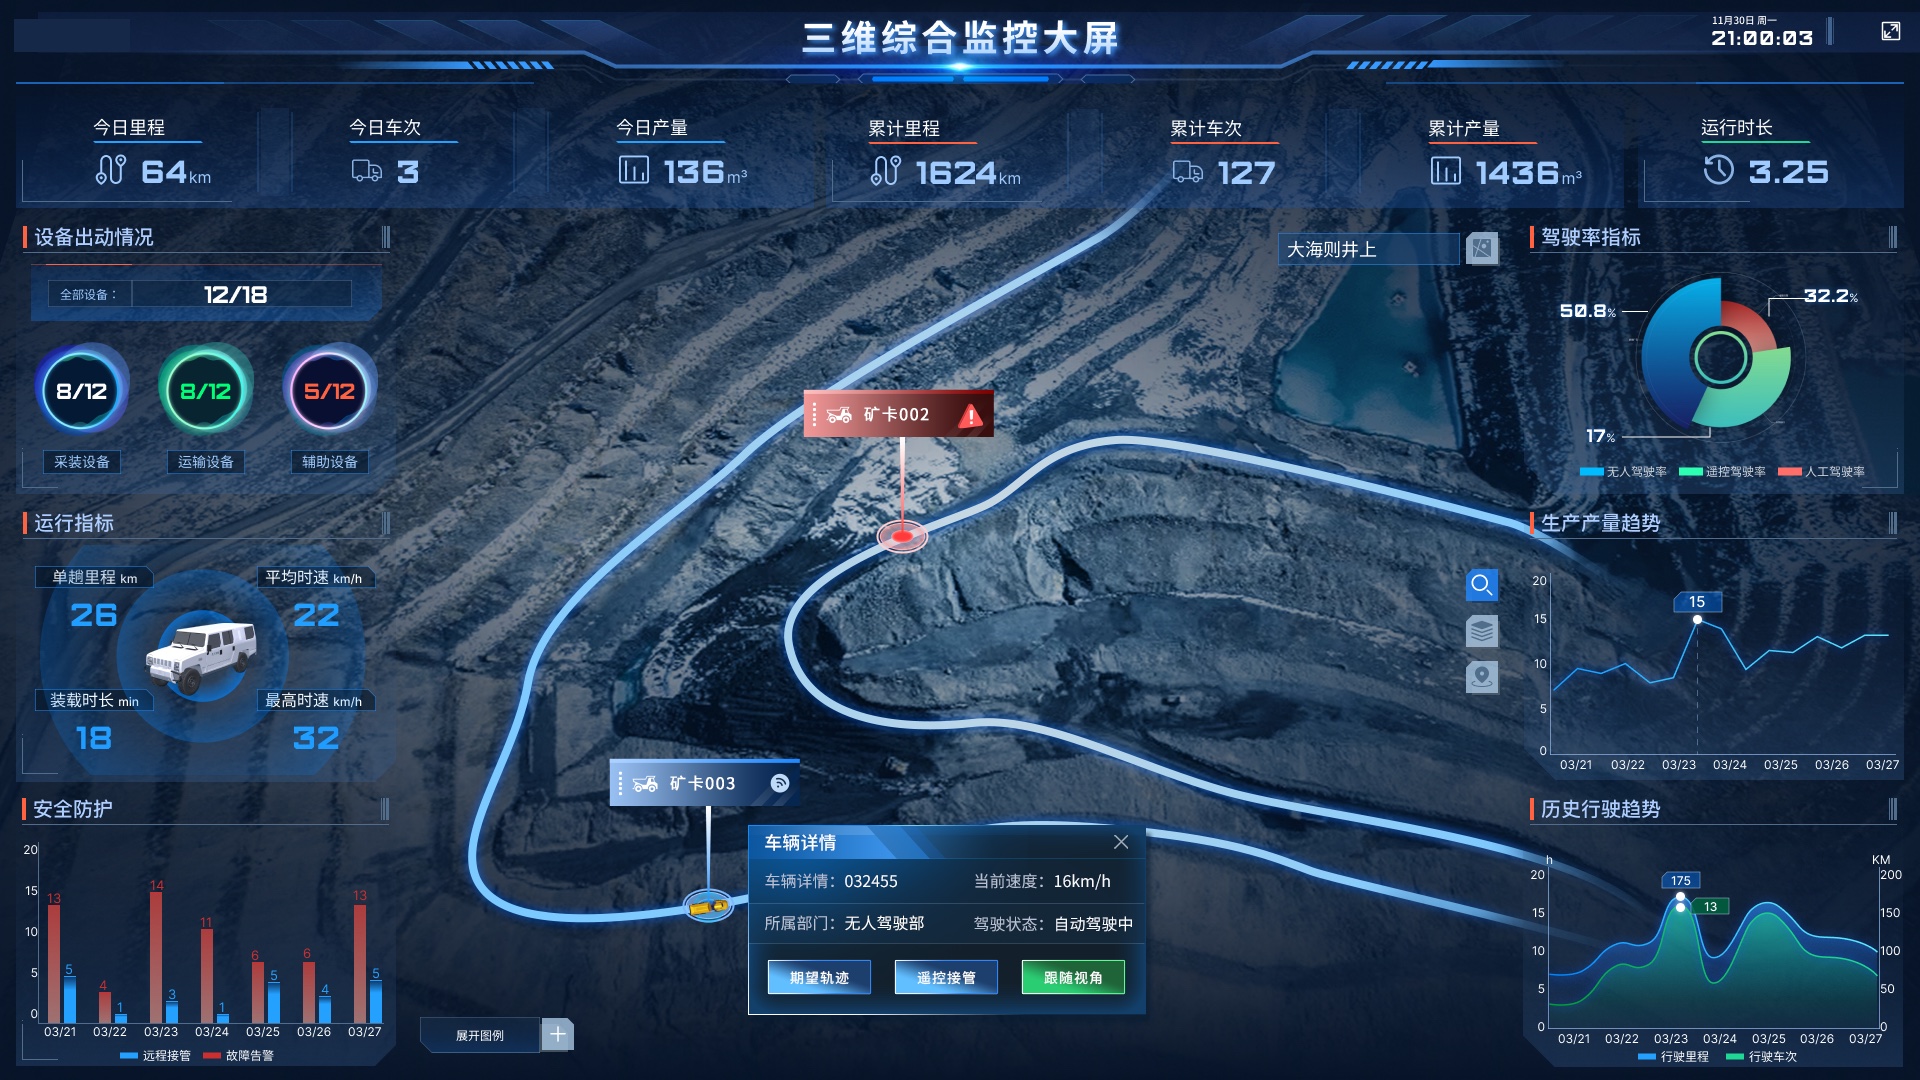
3D Integrated Monitoring Dashboard
A 3D mine scene connects vehicle routes, equipment status, safety trends, and alerts.
The 3D scene provides spatial context, while status panels connect overall conditions with specific anomalies.
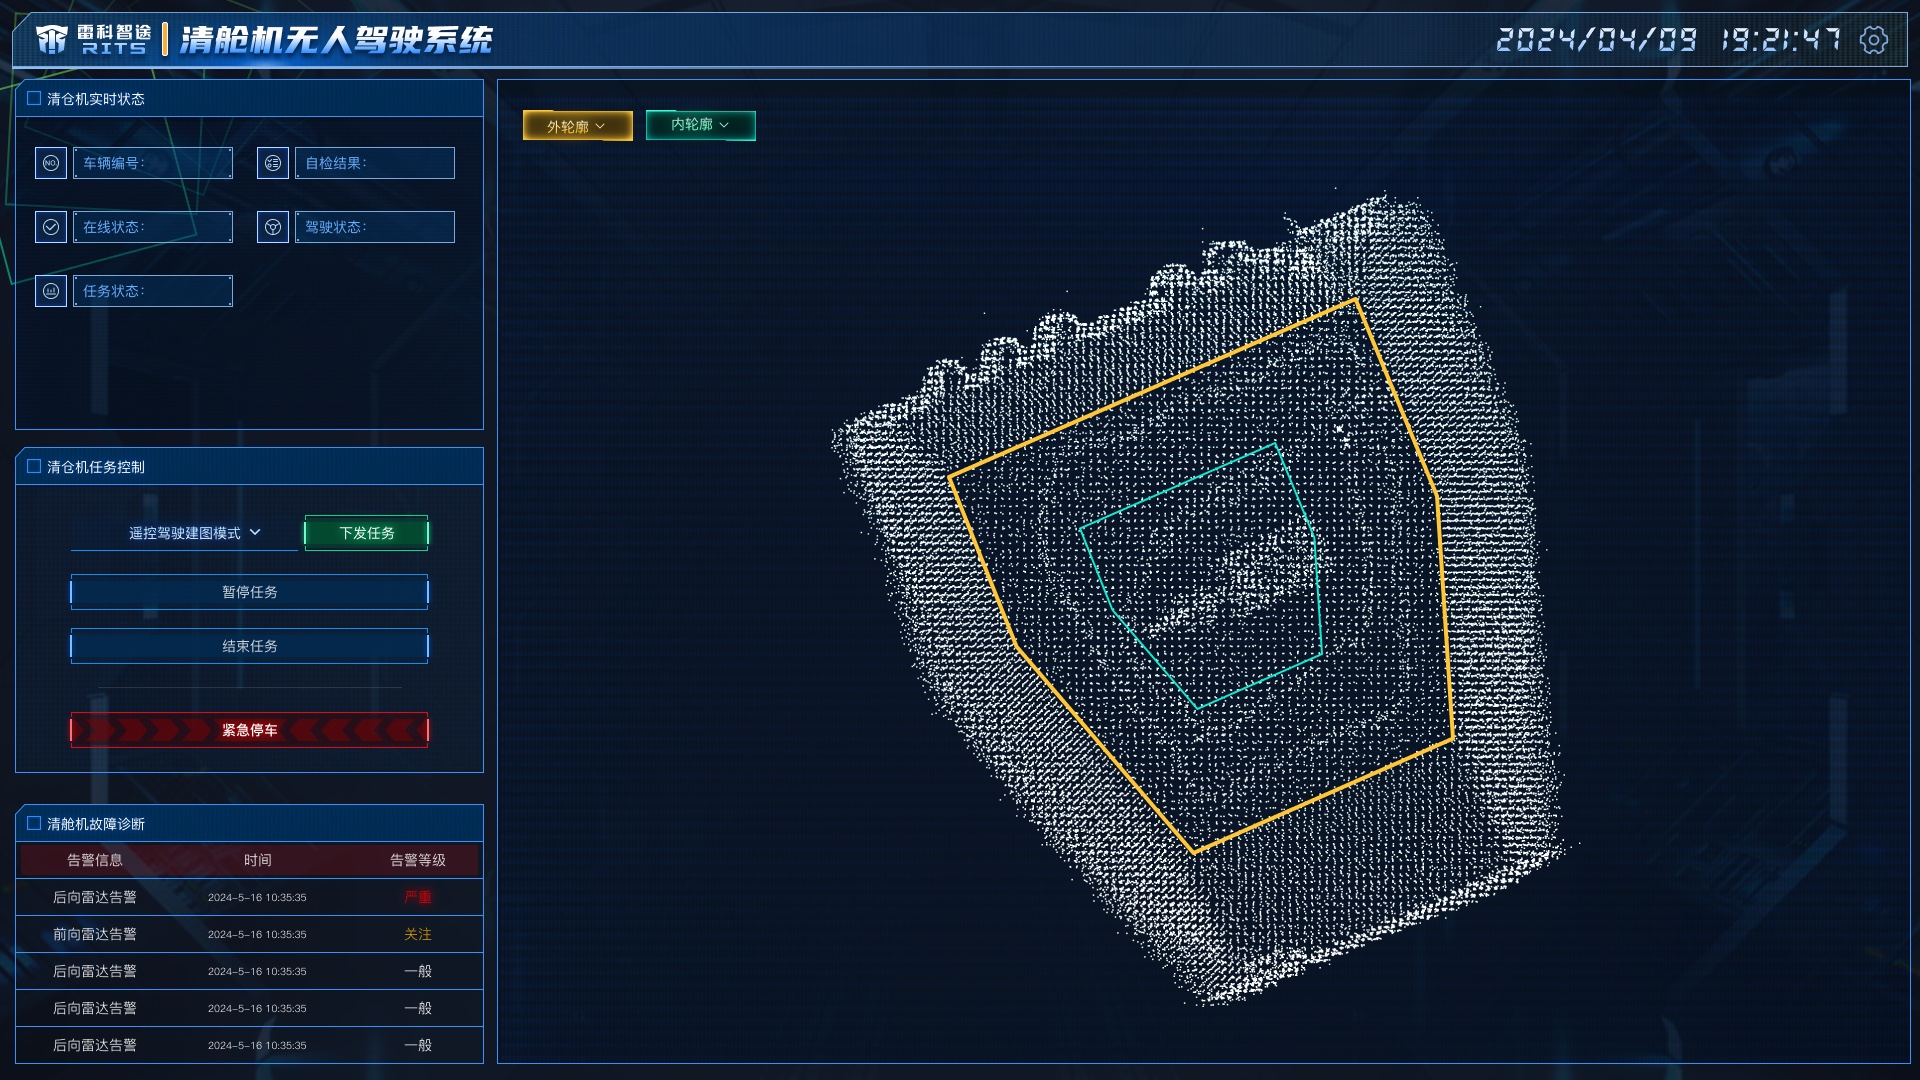
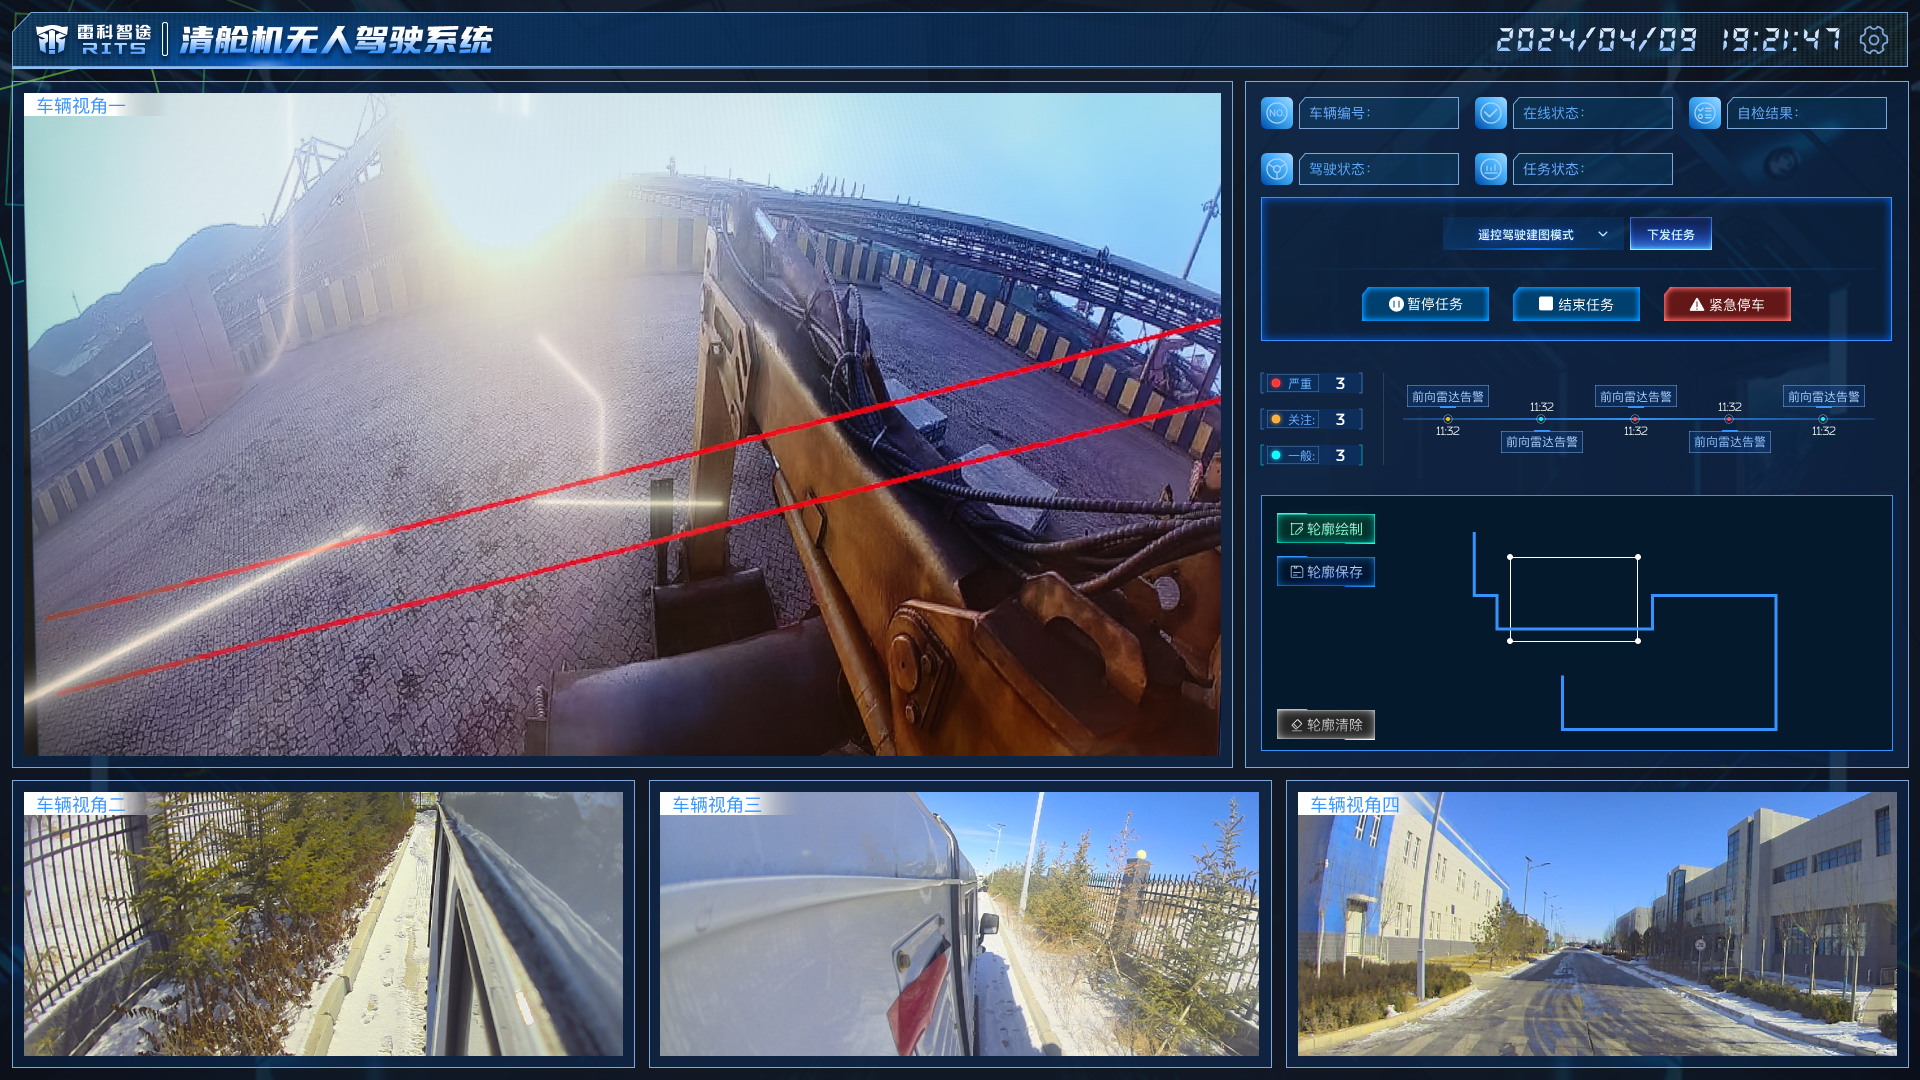
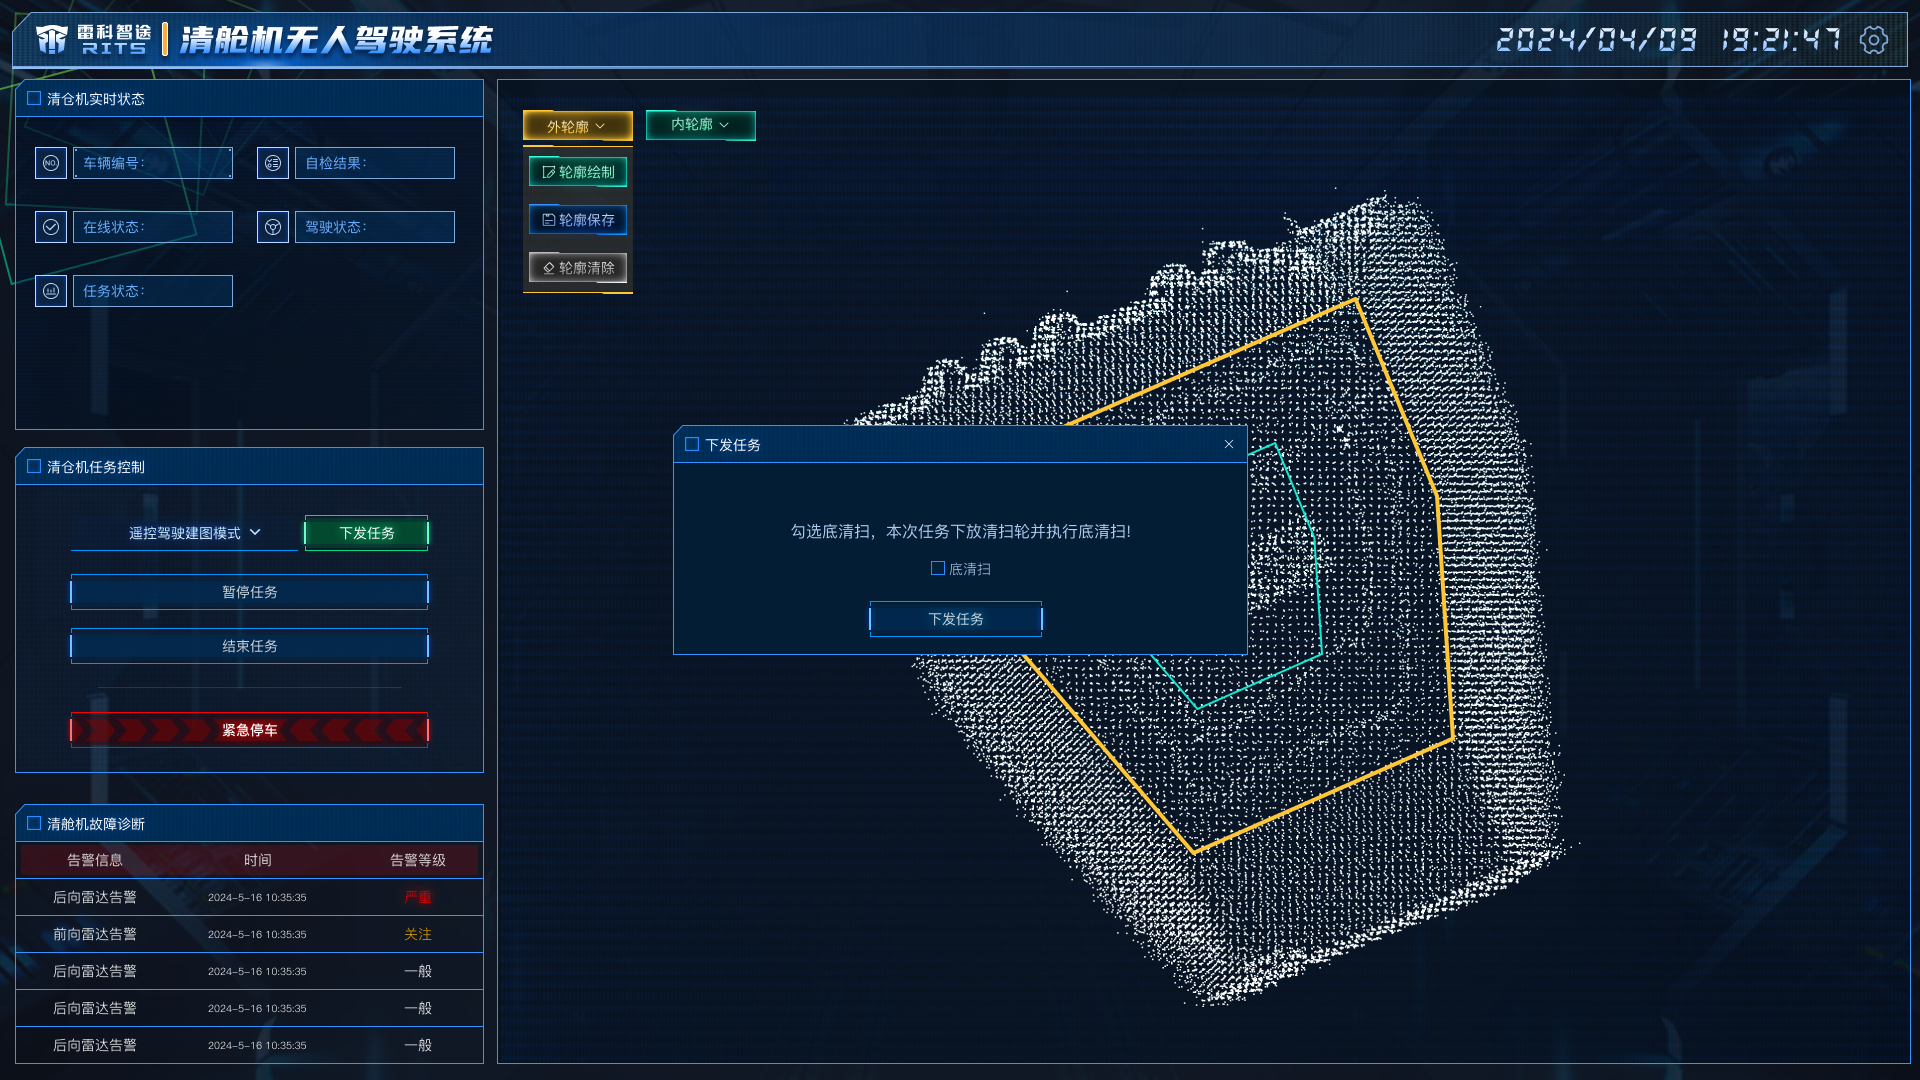
Autonomous Cabin-Cleaning Machine System
The cabin-cleaning workflow brings point clouds, task routes, live video, equipment status, and alerts into one view.
The work zone and point cloud form the main view, keeping monitoring, task control, and exception feedback in one flow.
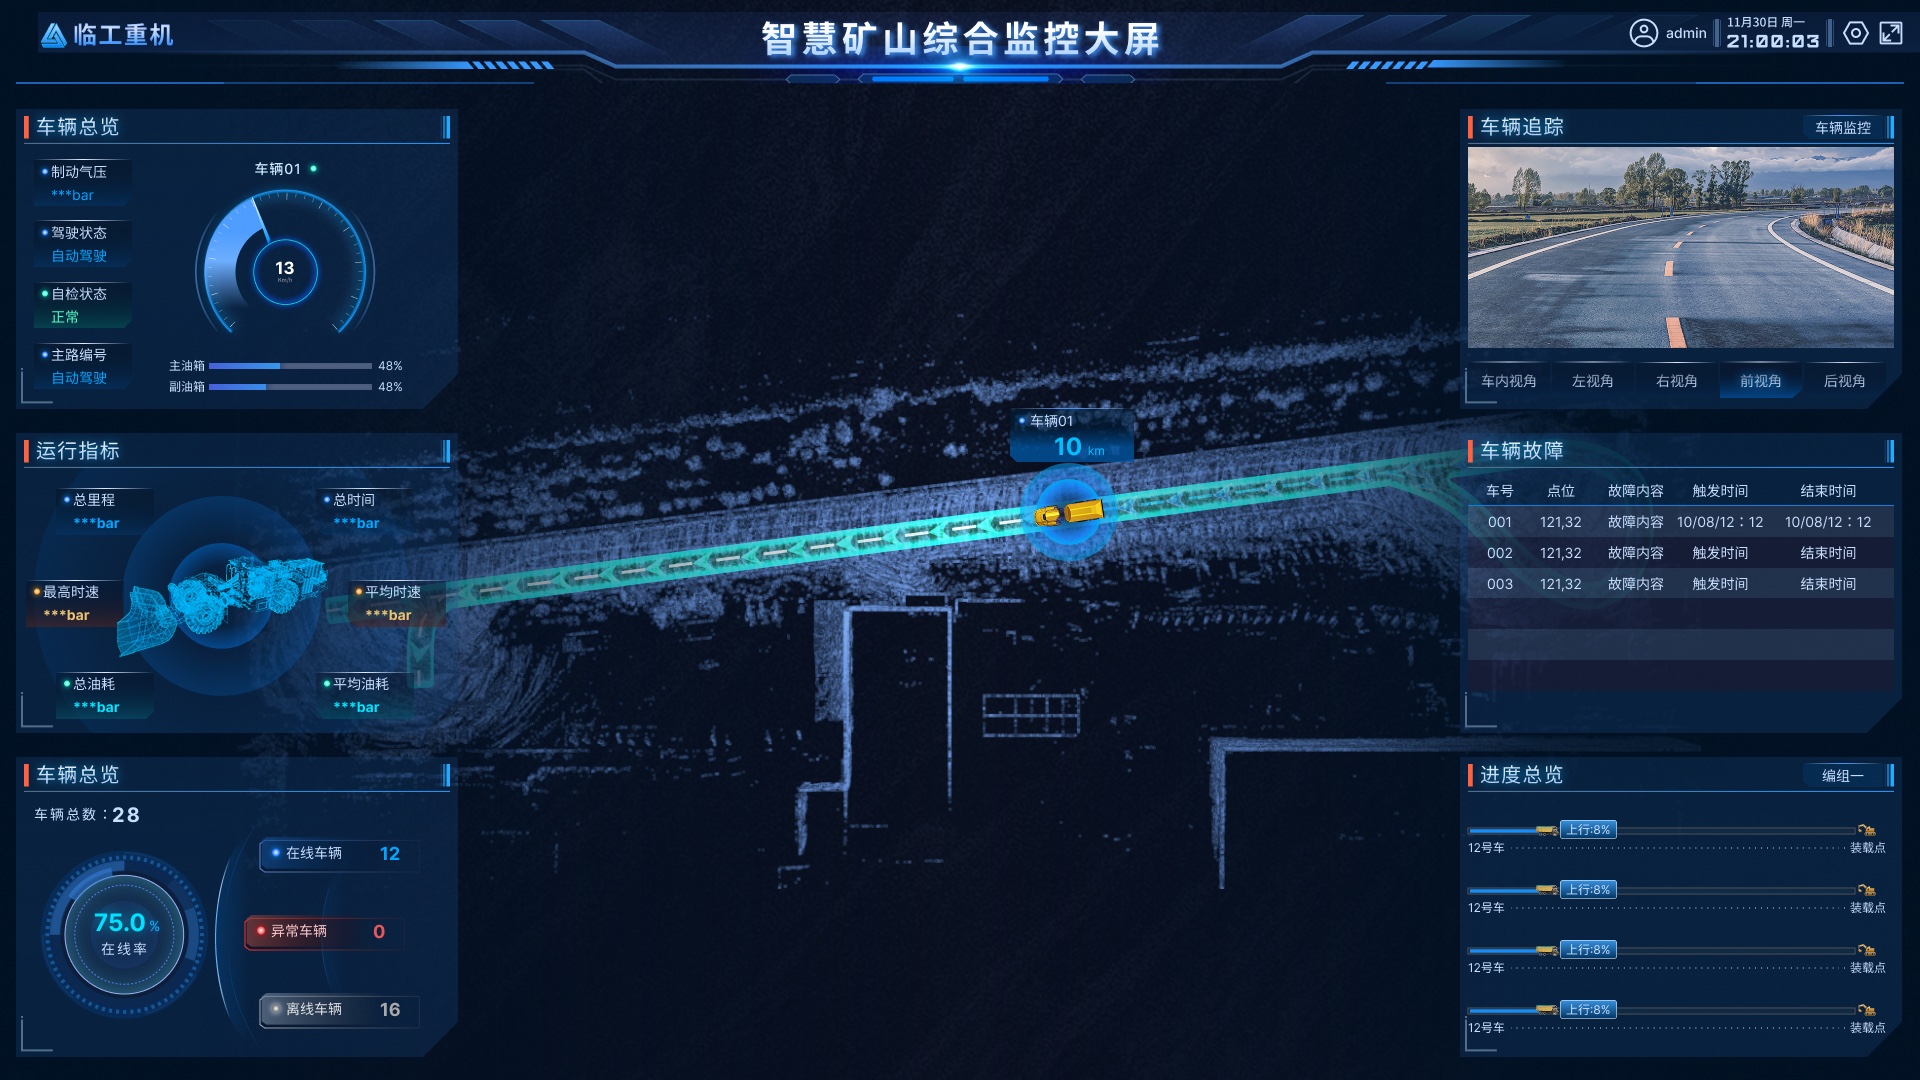
Smart Mining Integrated Monitoring Dashboard
A spatial mine view connects vehicles, routes, and dispatch status with task data and operating metrics.
Roads, vehicles, and tasks are spatially linked, supported by status lists and trend indicators.
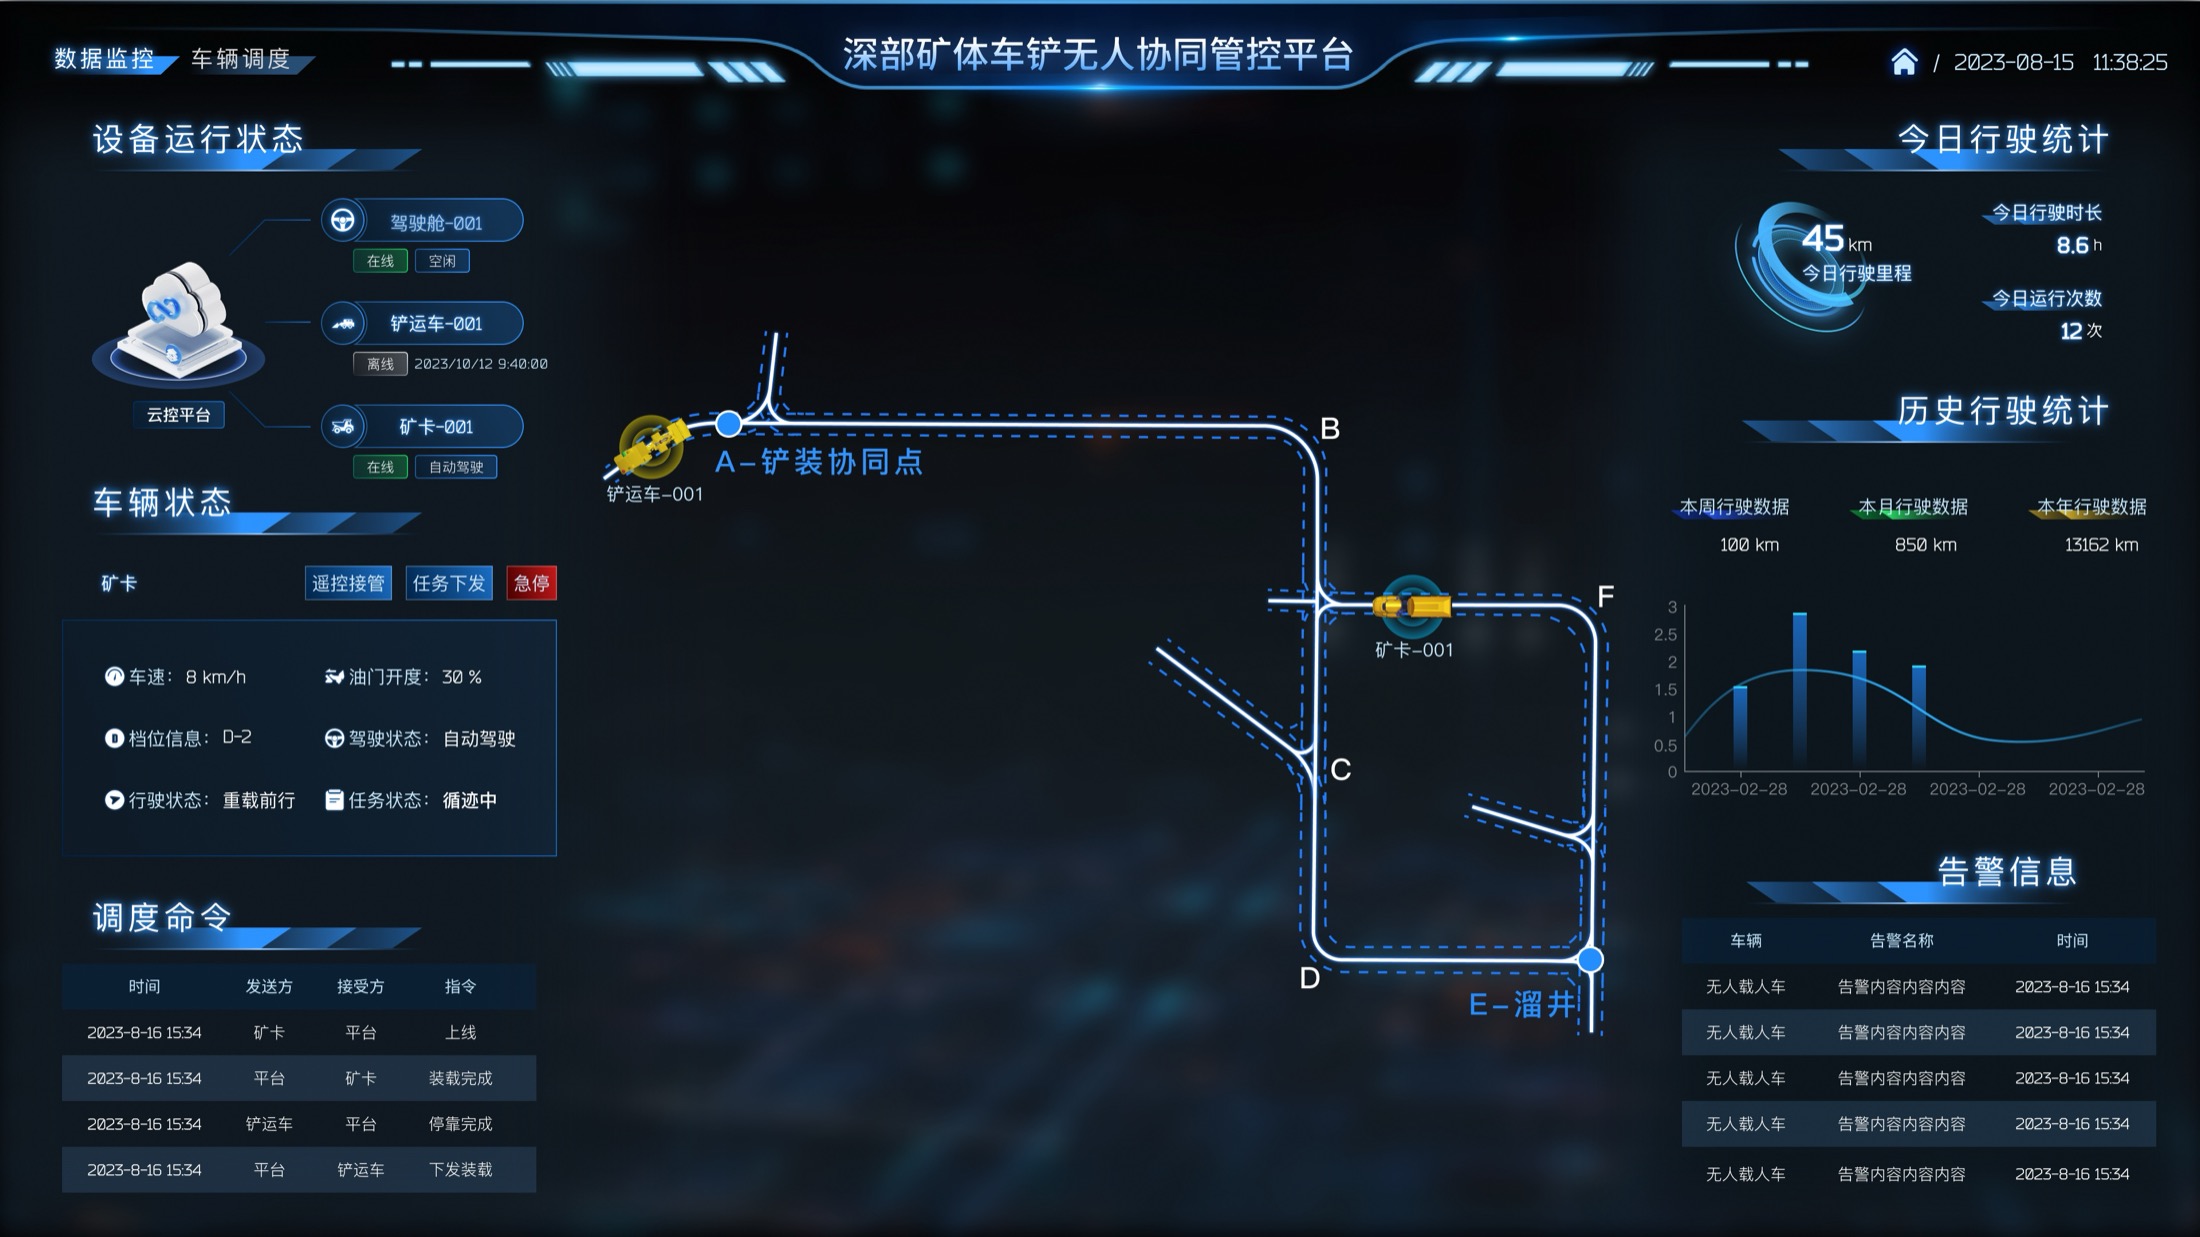
Deep-Mine Vehicle–Excavator Coordination Platform
The vehicle–excavator workflow combines equipment status, route nodes, dispatch commands, operating statistics, and alerts.
The map shows vehicle–route relationships; task and vehicle management views connect real-time status with operating history.
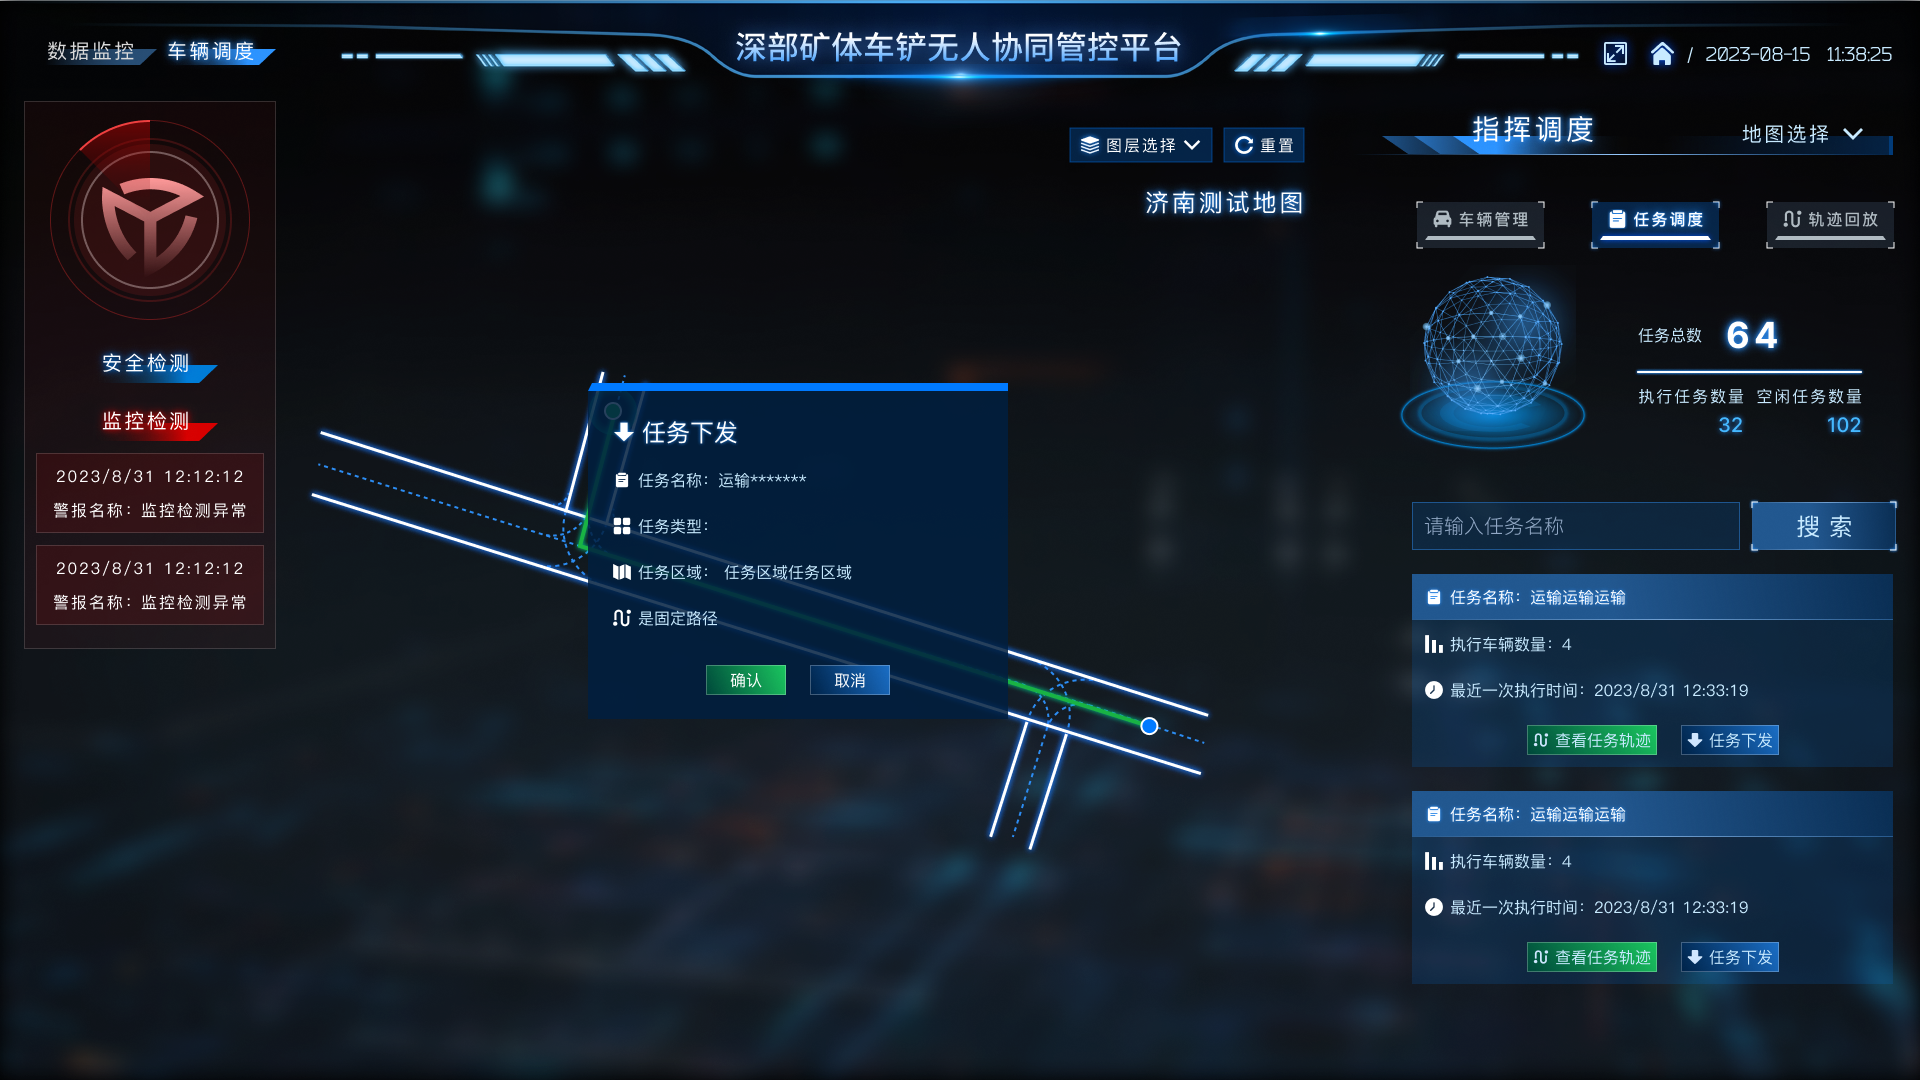
Task Dispatch
Review tasks, assigned objects, and current execution status.
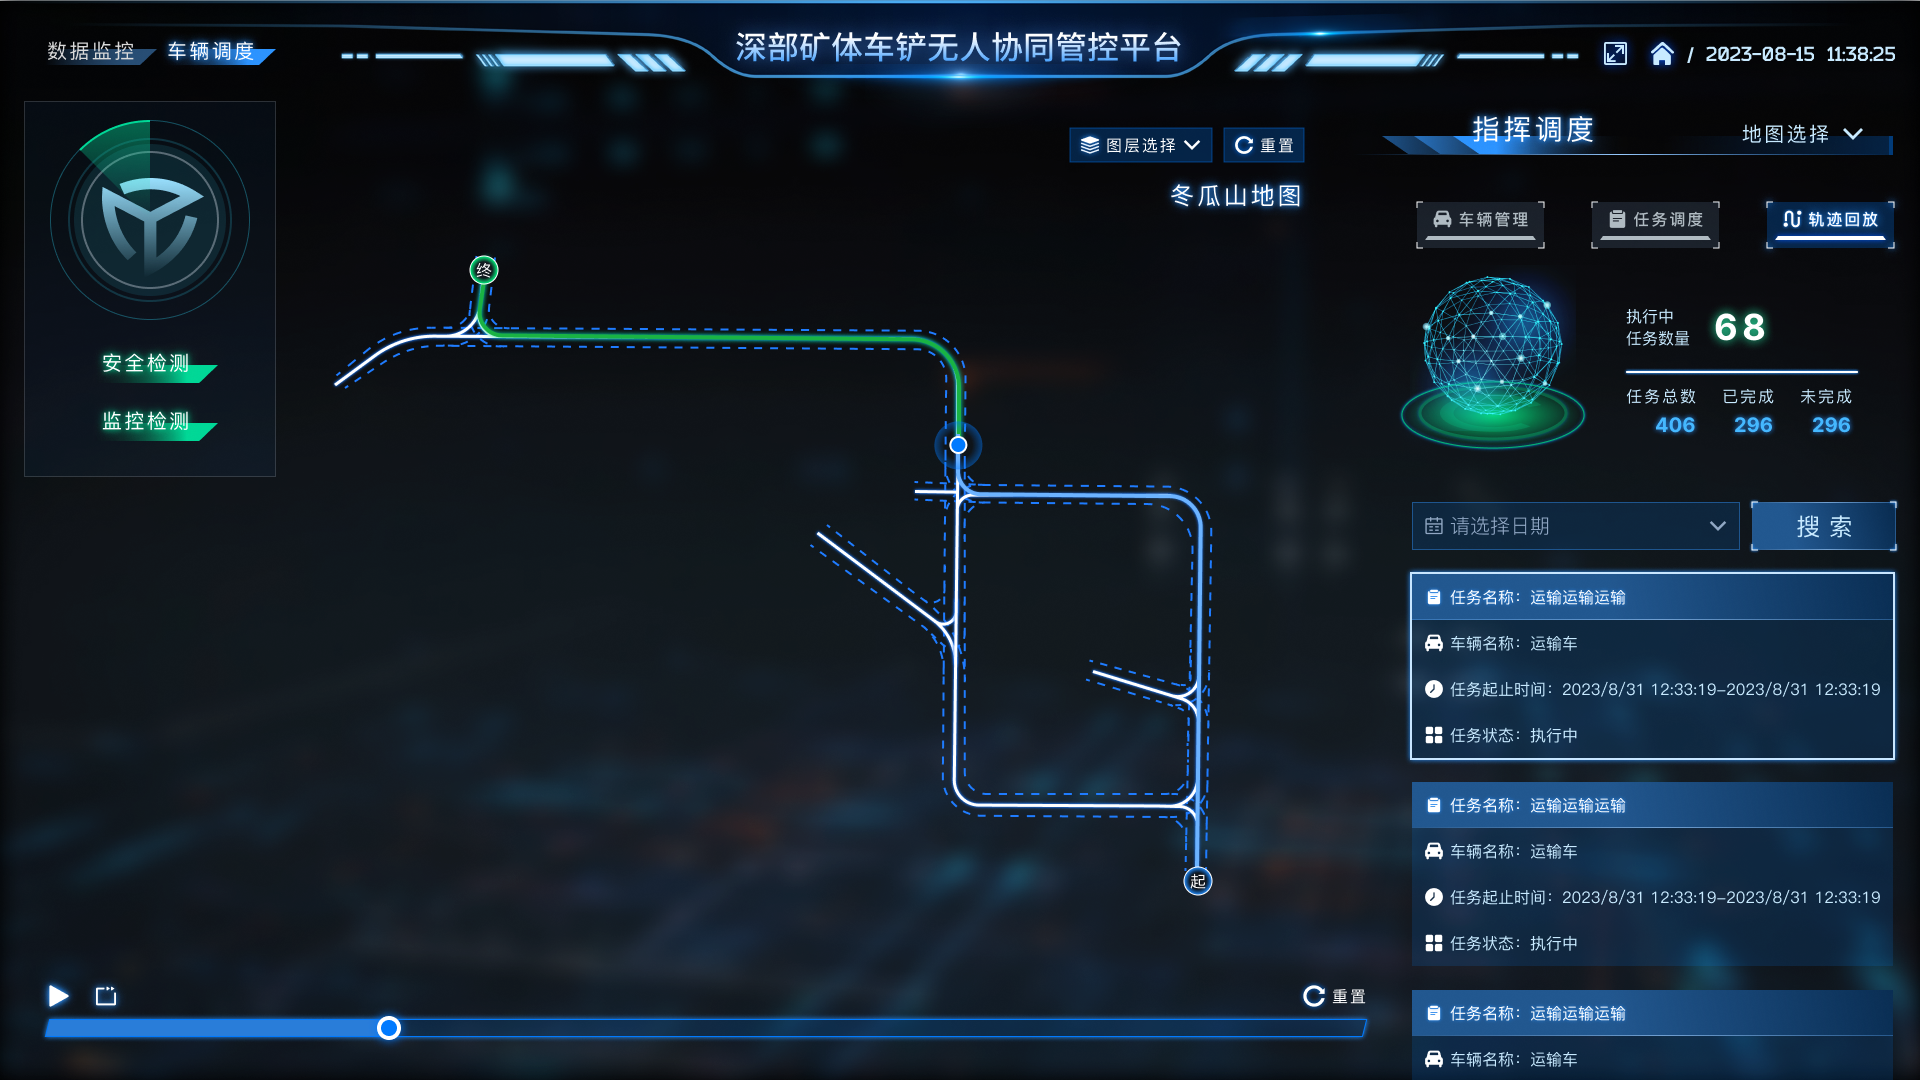
Trajectory Playback
Review operations through both time and spatial context.
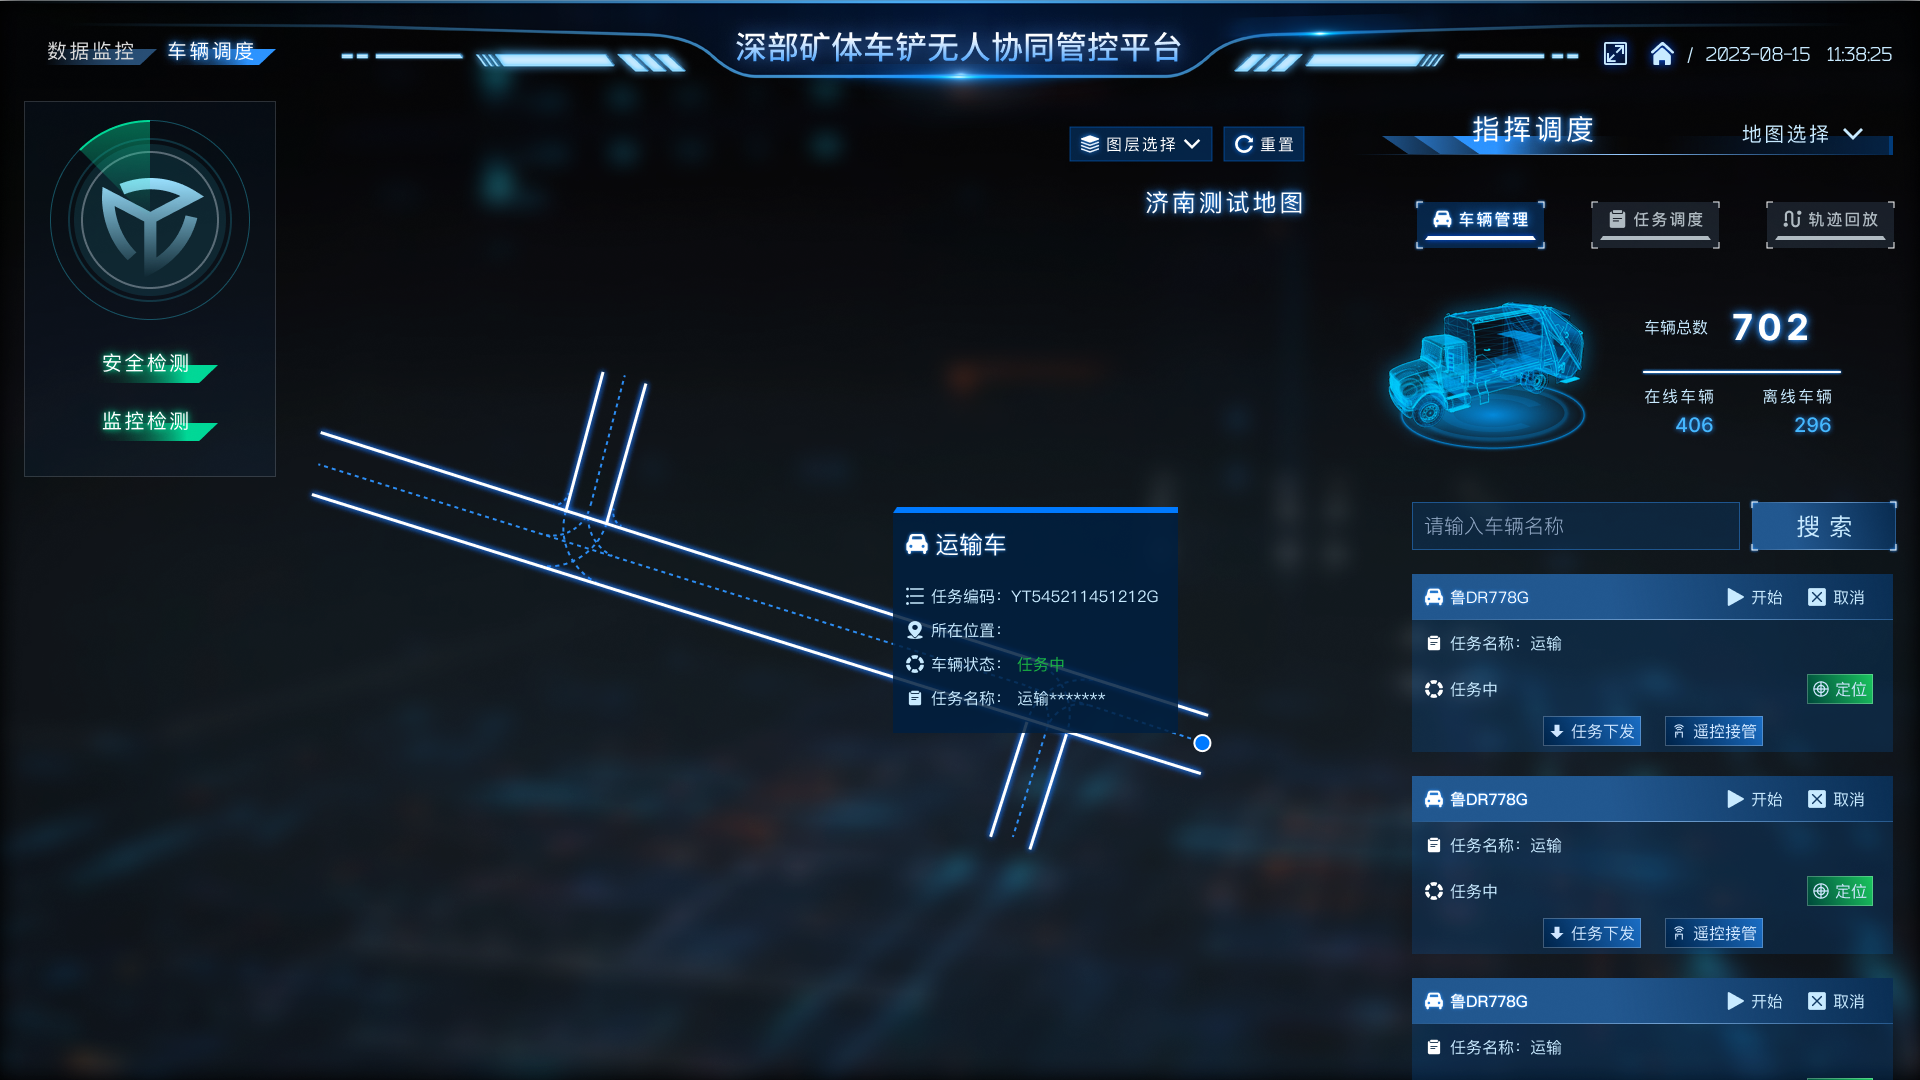
Vehicle Management
Centralize vehicle information, operating records, and management actions.
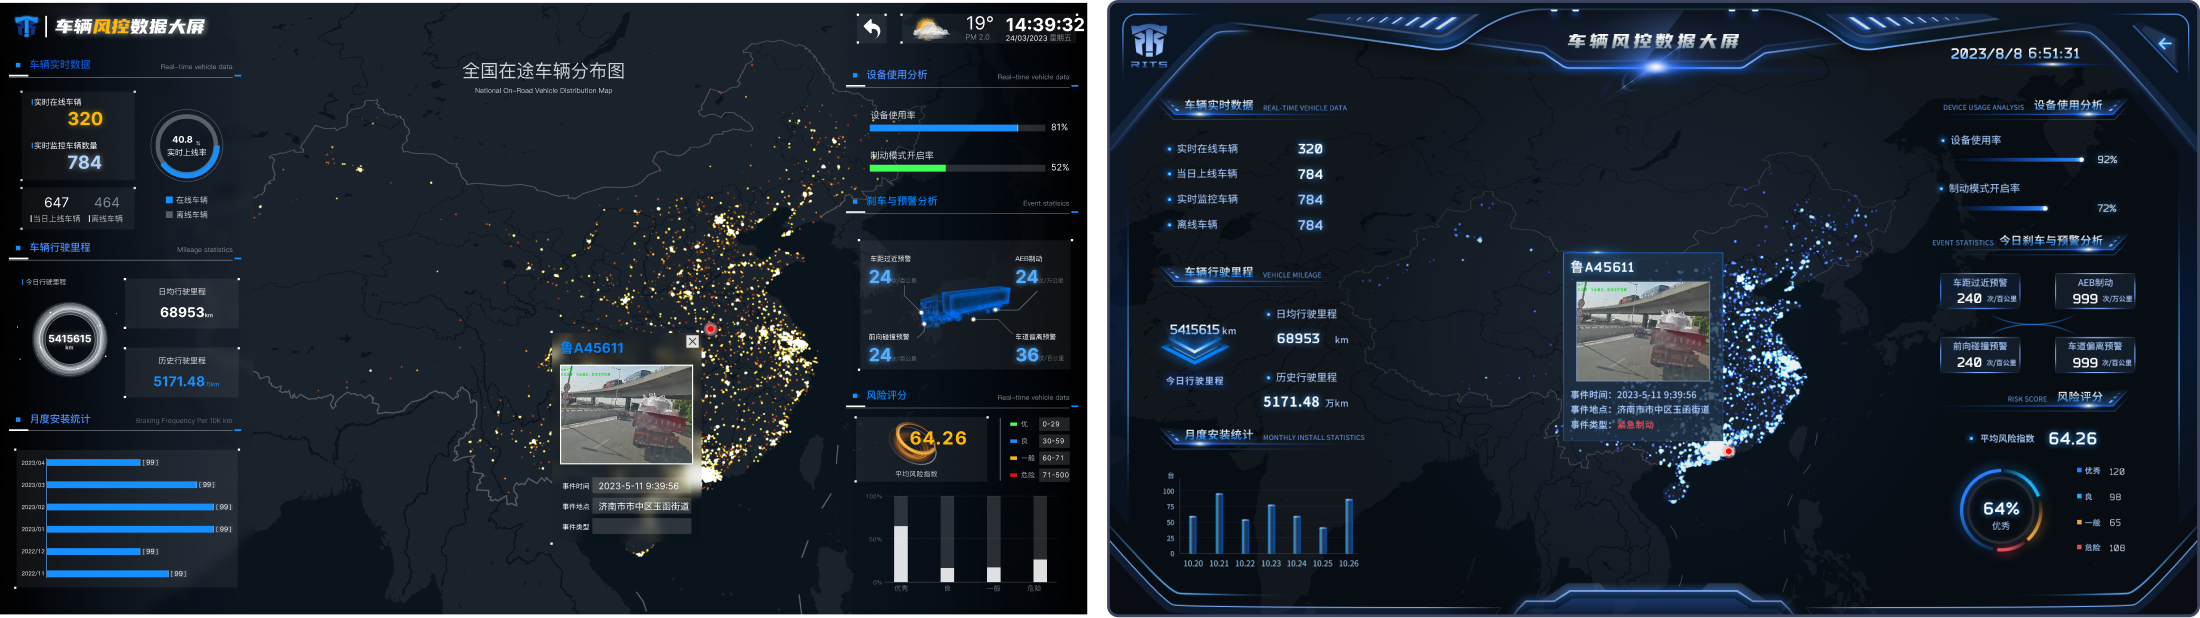
Vehicle Risk Control Dashboard
A national fleet map is paired with vehicle profiles, risk levels, exceptions, and trend indicators.
The map identifies priority regions; vehicle profiles and risk indicators lead to specific objects.

5G Emergency Command Center
Emergency resources, regional conditions, equipment status, and treatment data form one connected display system.
The overview shows resource and regional changes before maps and device views lead to specific tasks.
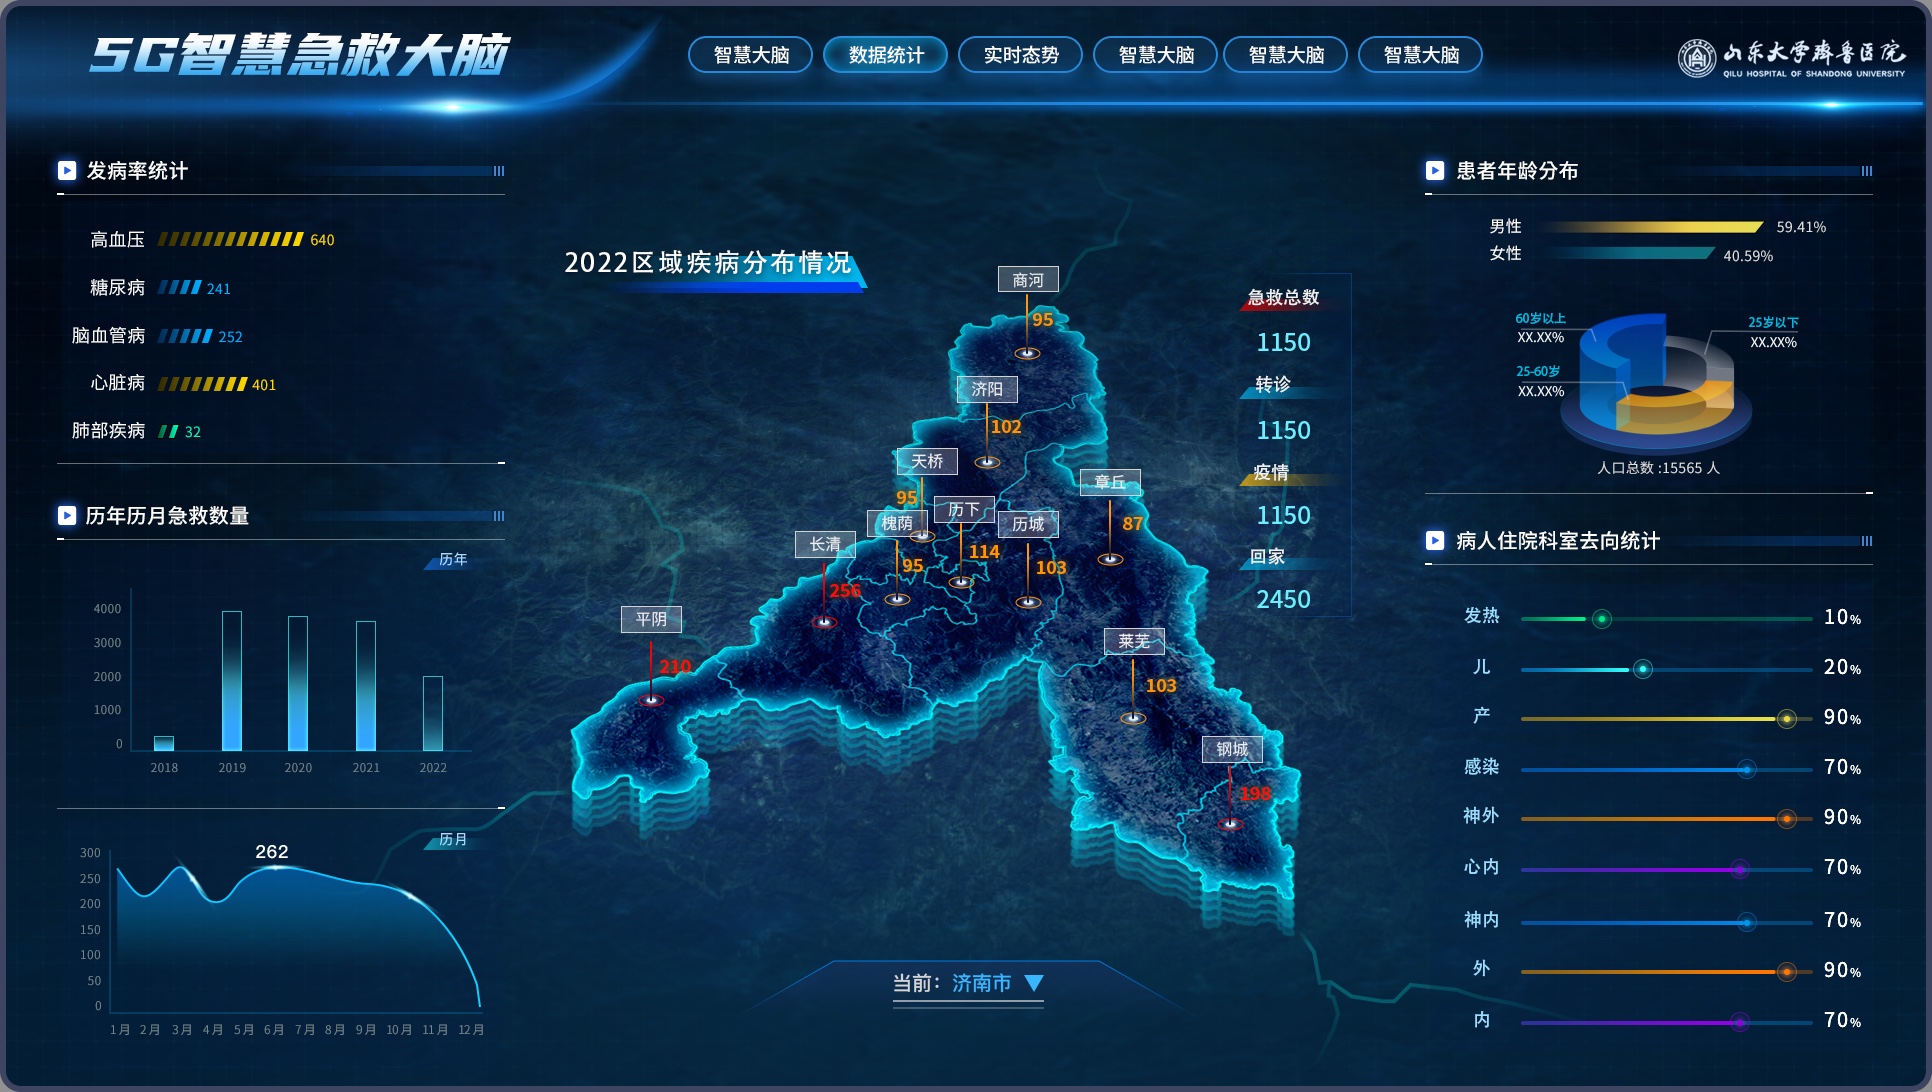
5G Emergency Command Center · Regional Situation
A map organizes emergency resources, patient distribution, historical trends, and device status.
The map anchors regional conditions; trends and device data explain changes and locate resources.
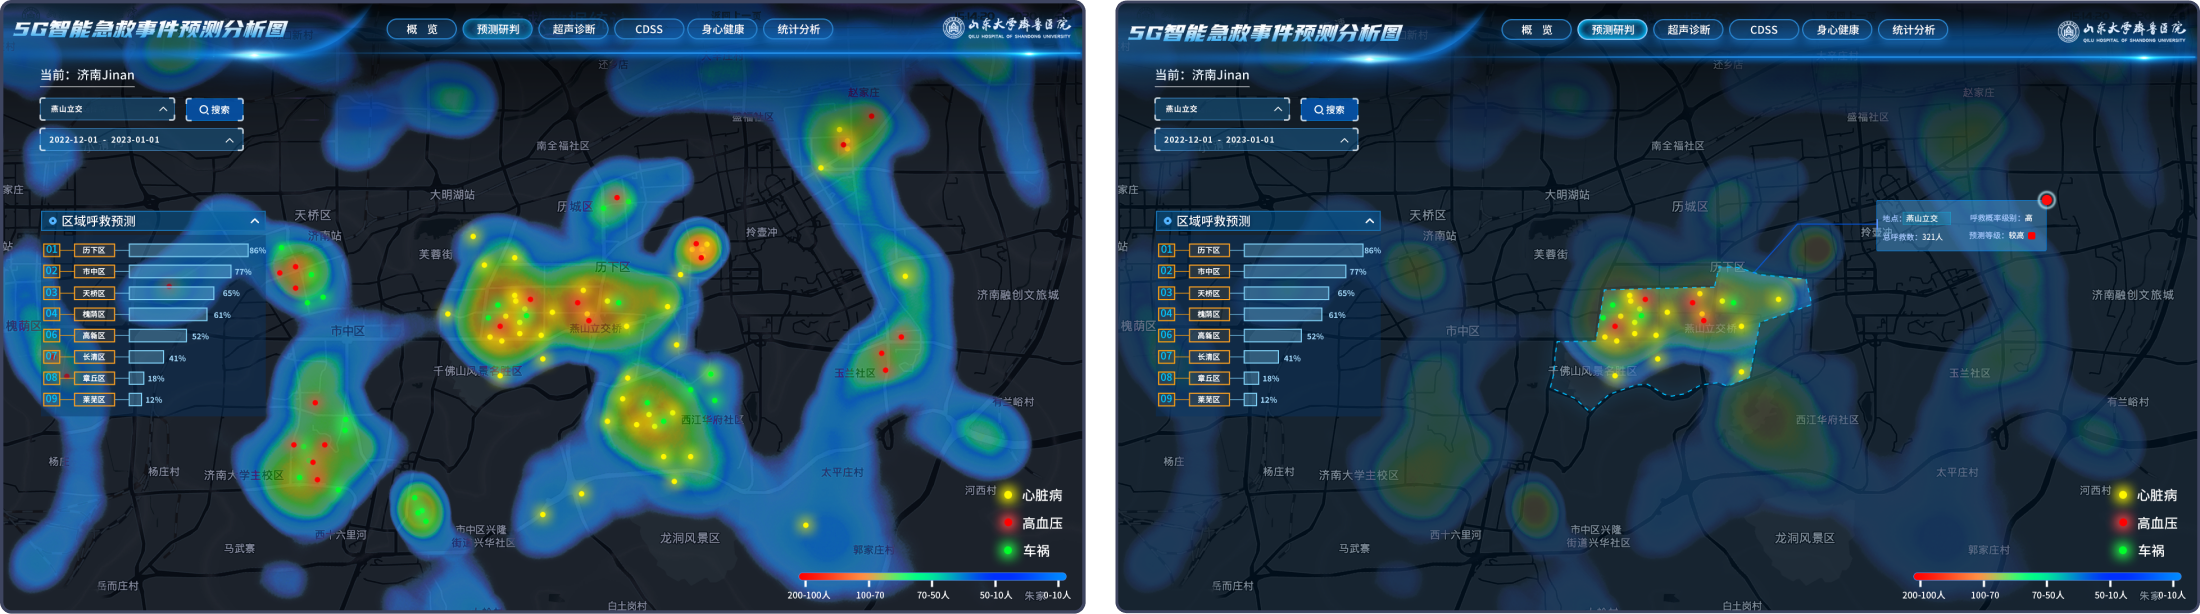
5G Emergency Event Forecast
Regional heatmaps, event distribution, and time trends reveal changes in emergency demand.
Heatmaps show spatial differences; time trends make forecast results easier to compare and review.
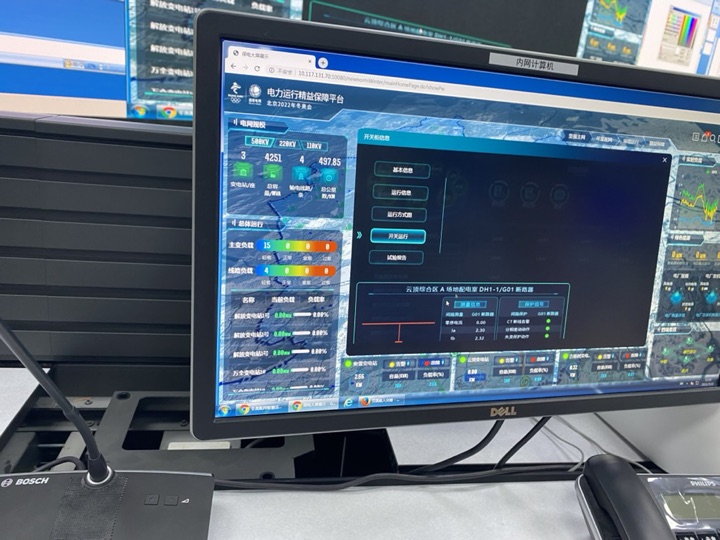
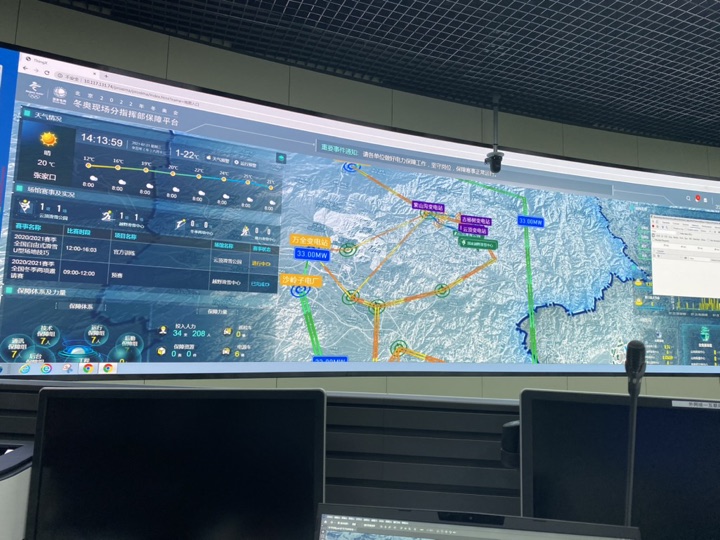
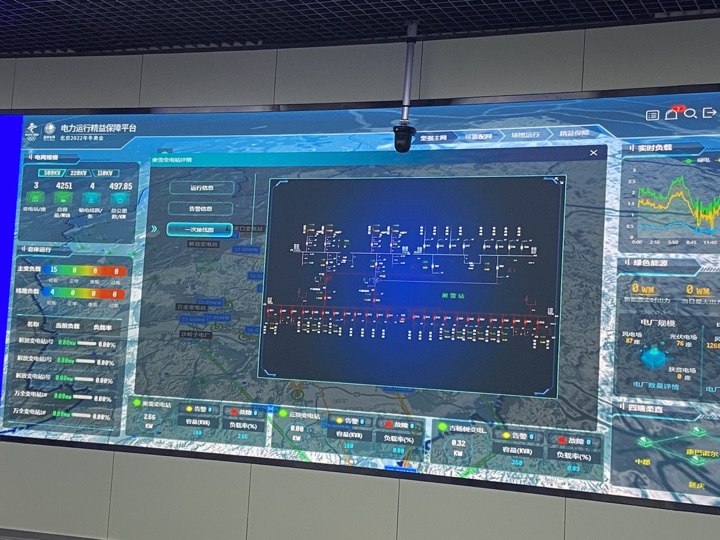
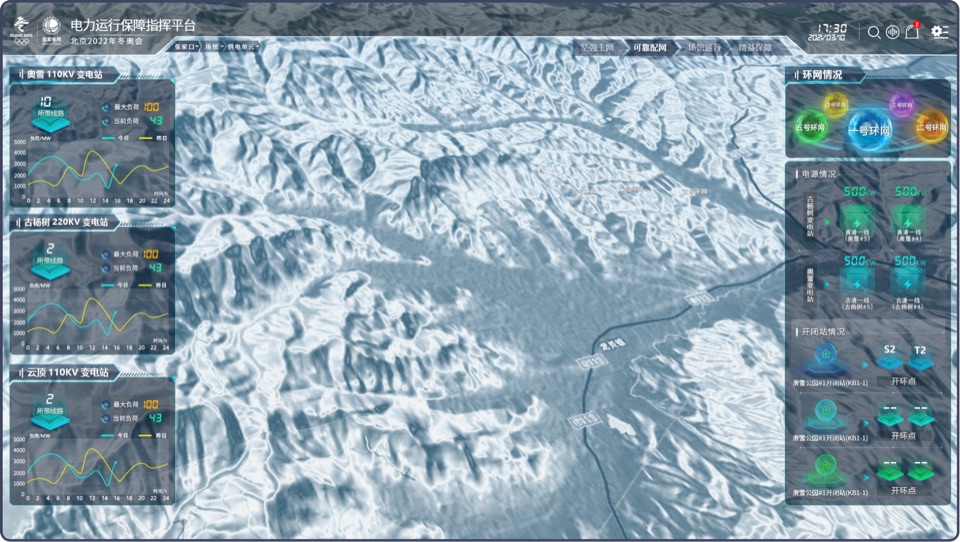
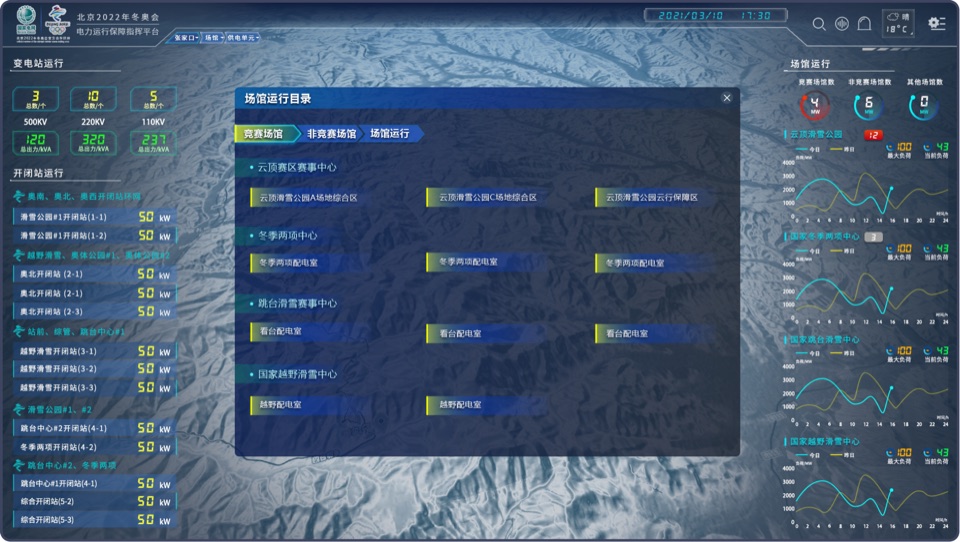
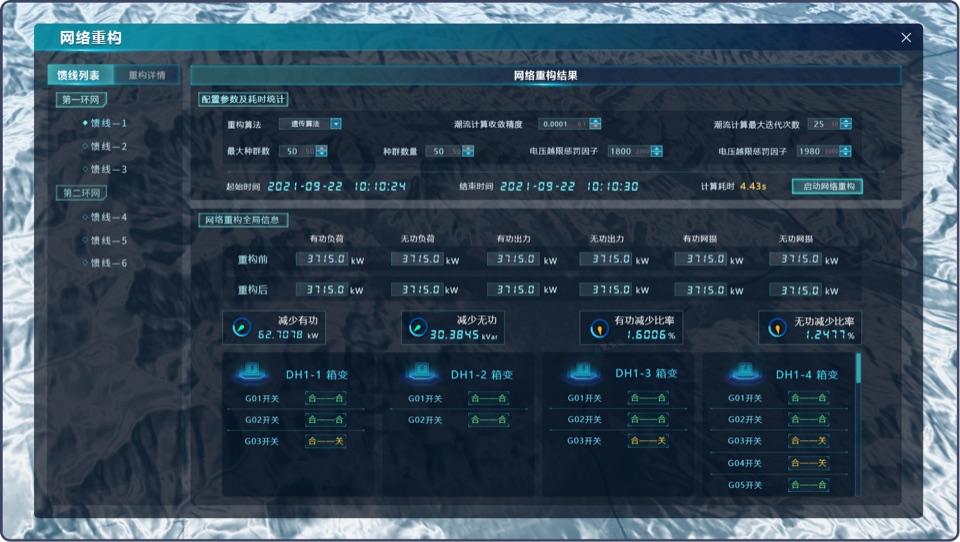
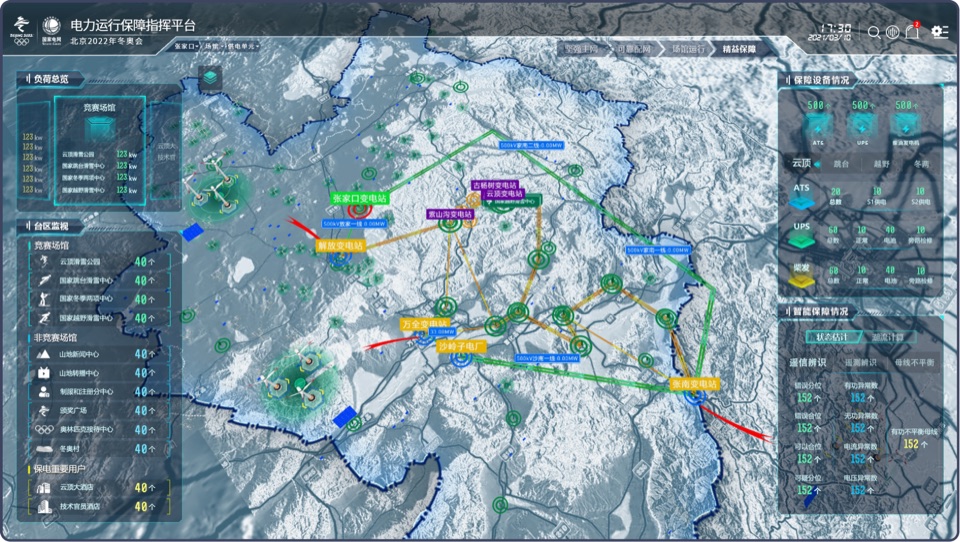
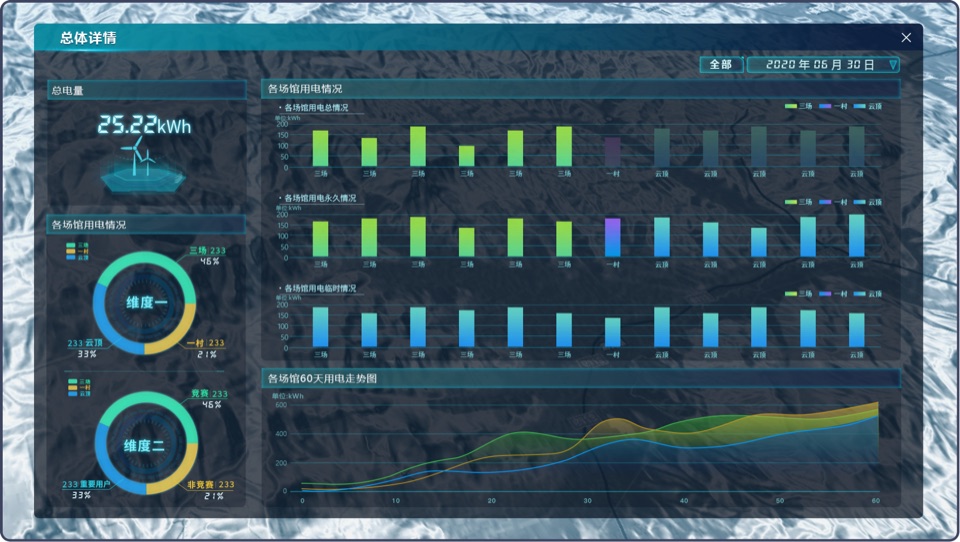
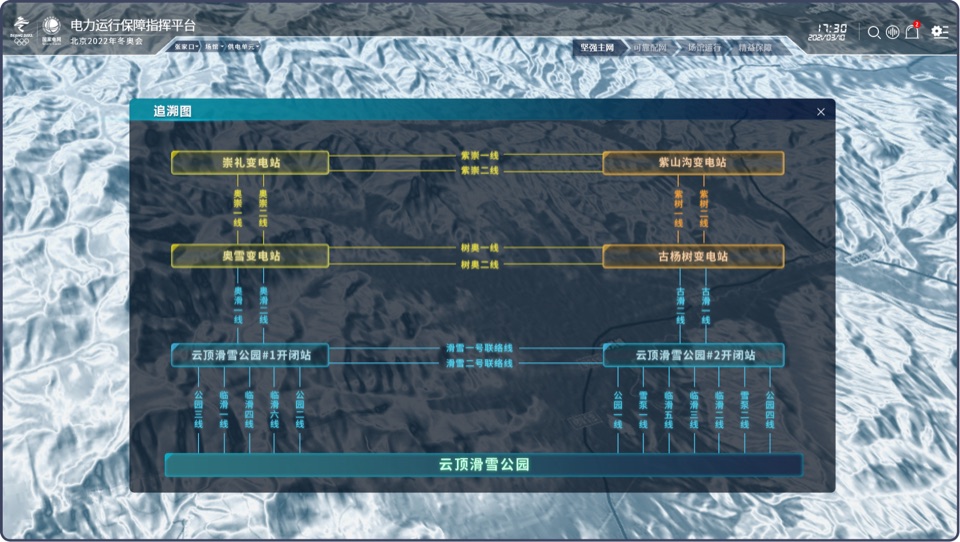
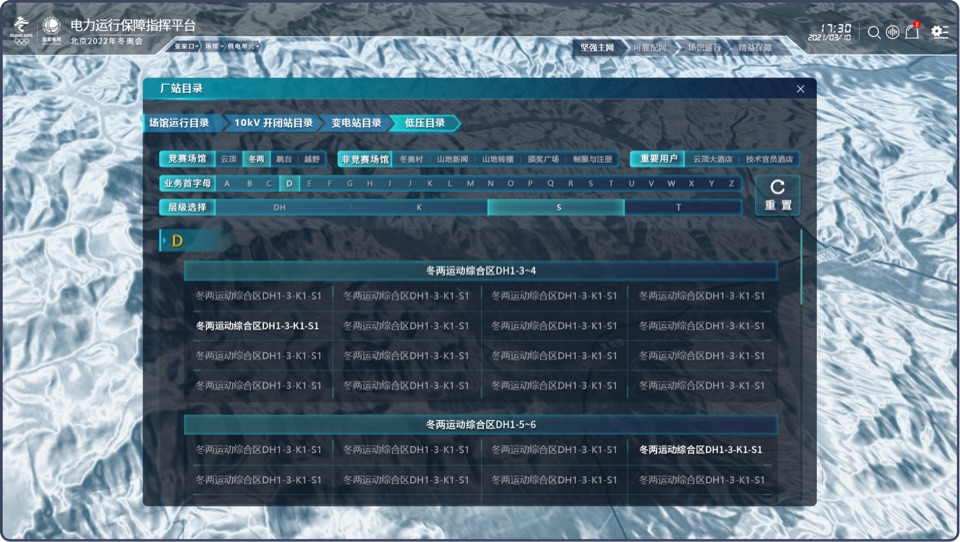
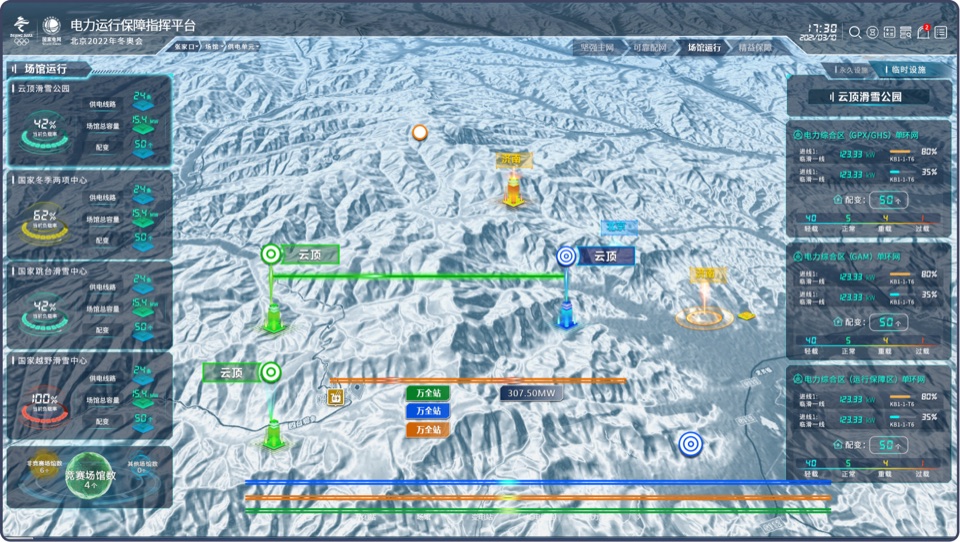
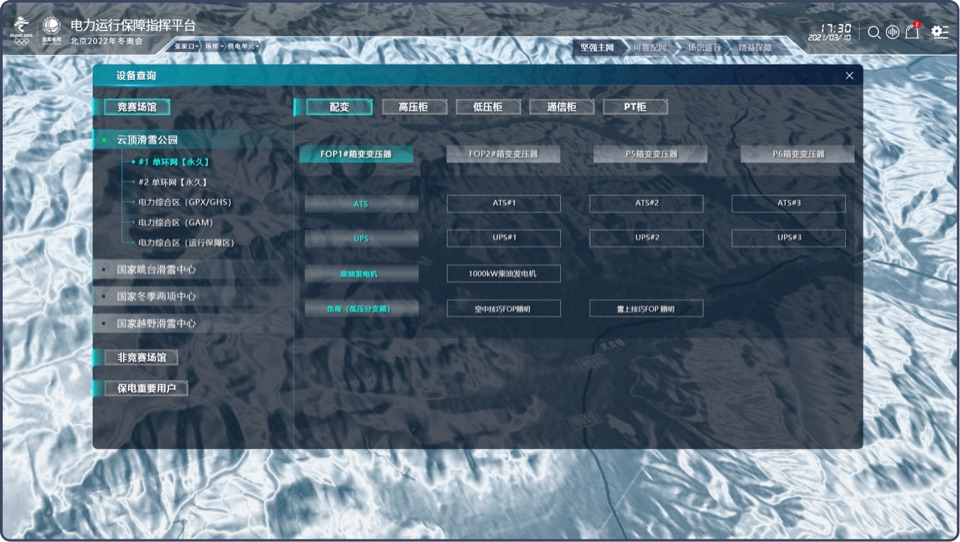
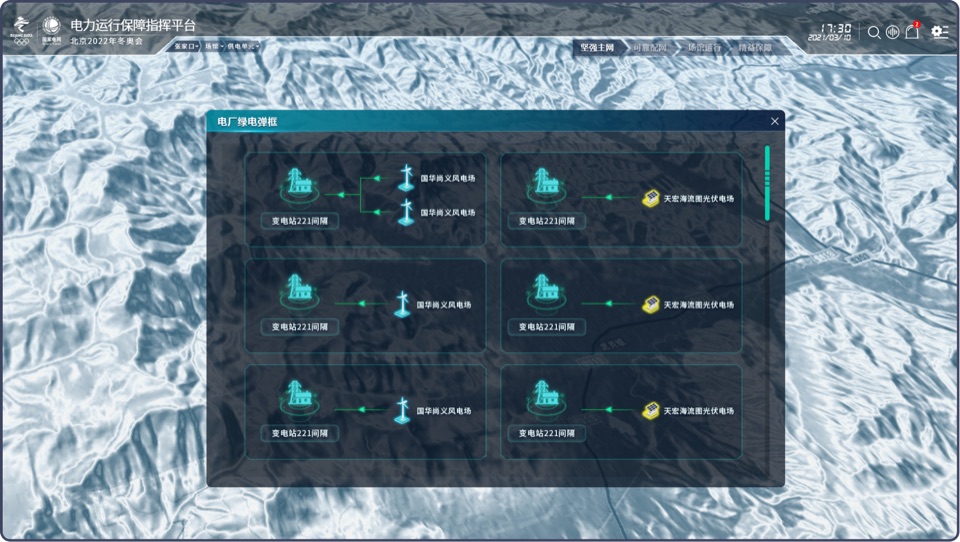
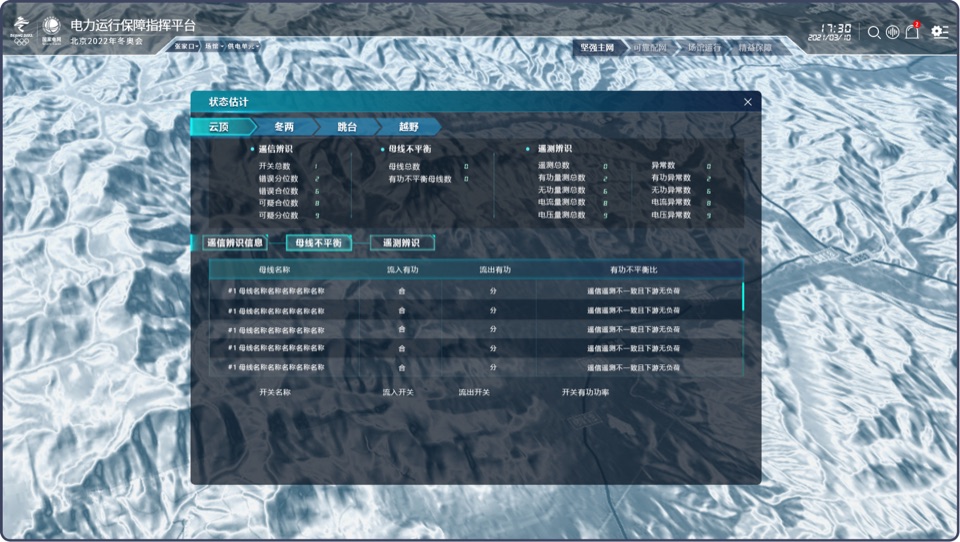
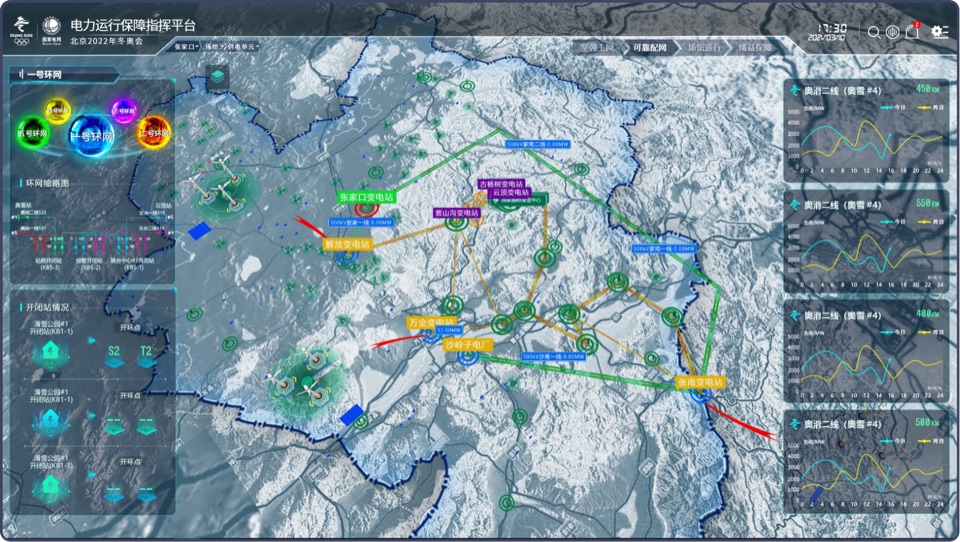
2022 Winter Olympics Power Assurance System
Designed for 2022 Winter Olympics power assurance, covering grid status, venue supply, resources, performance, and event traceability.
Overall conditions, venue operations, analysis, and traceability are organized as a durable multi-page monitoring system.
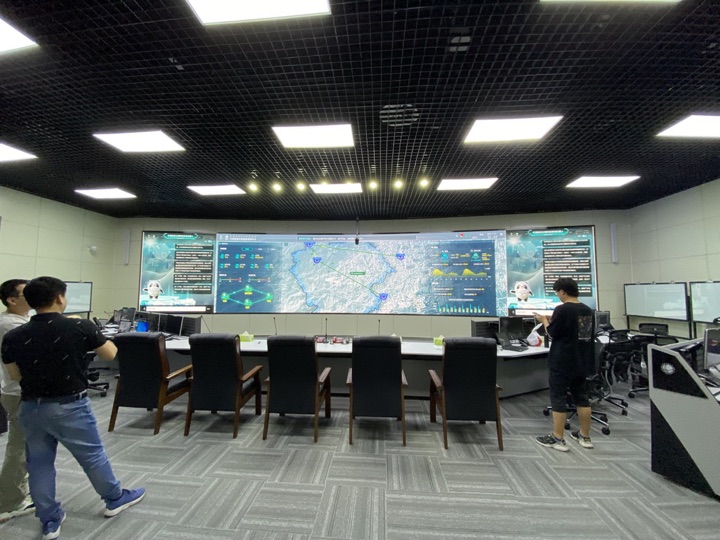
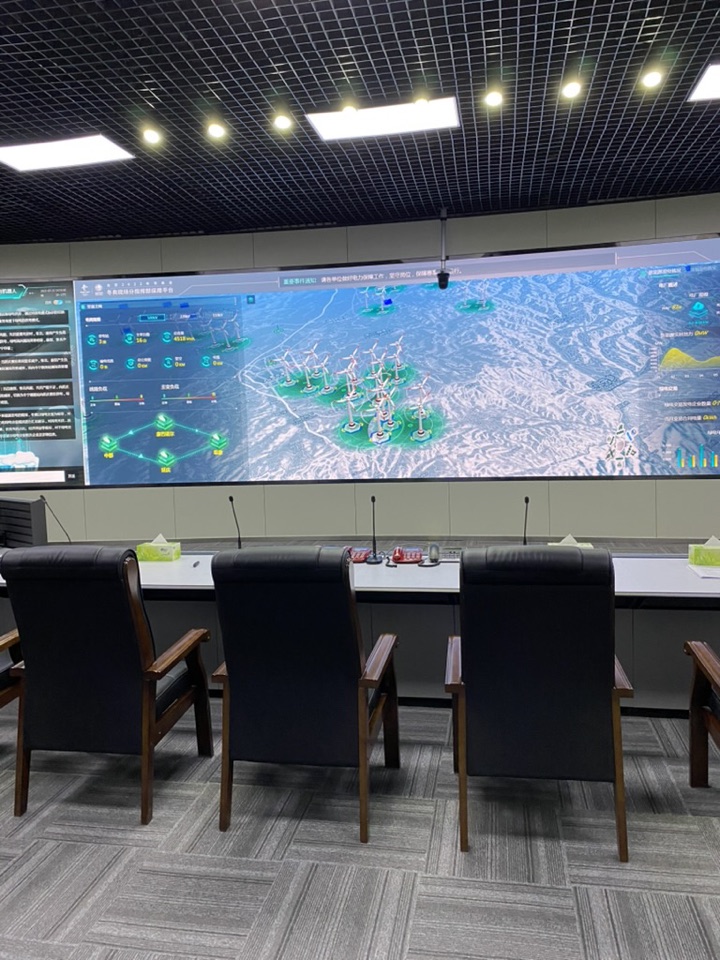
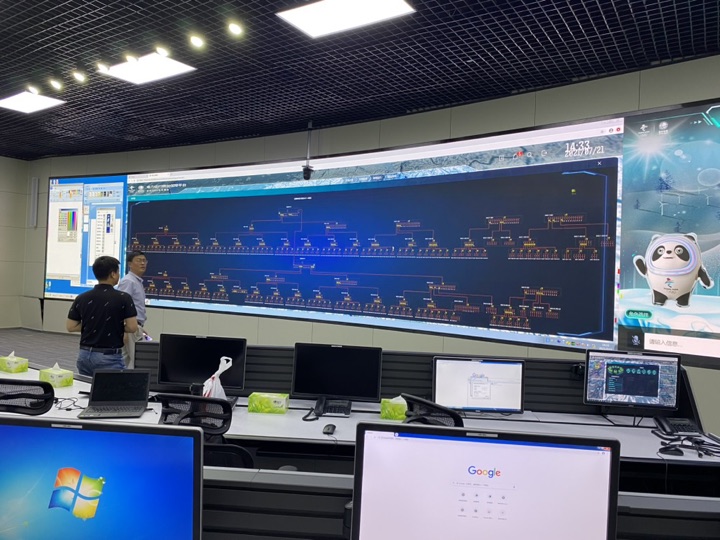
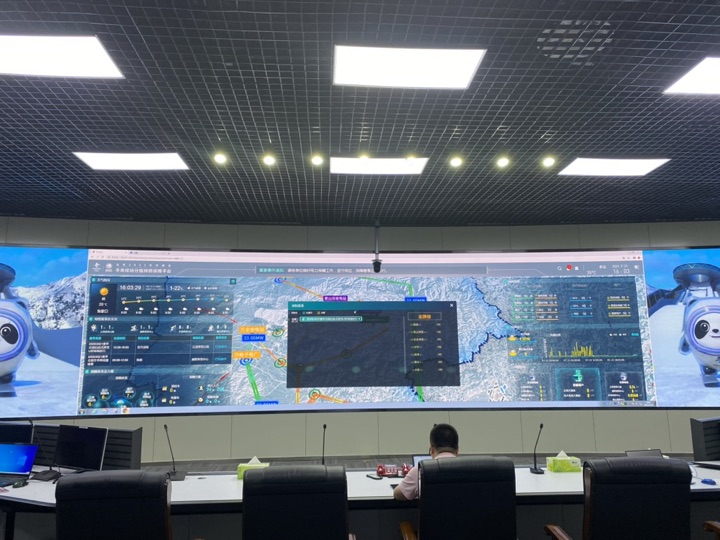
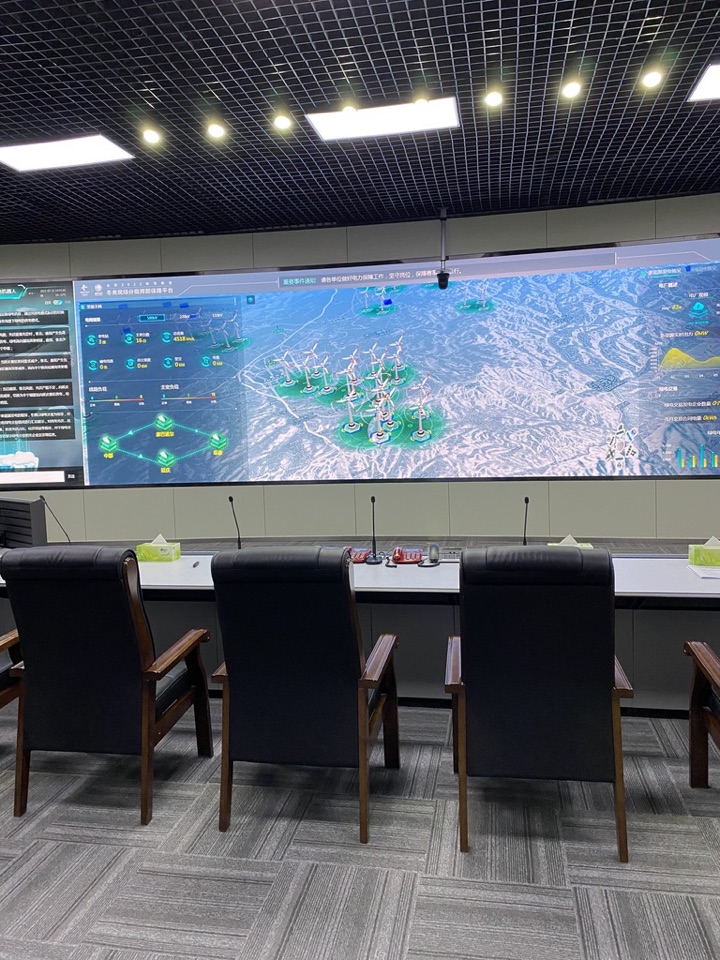
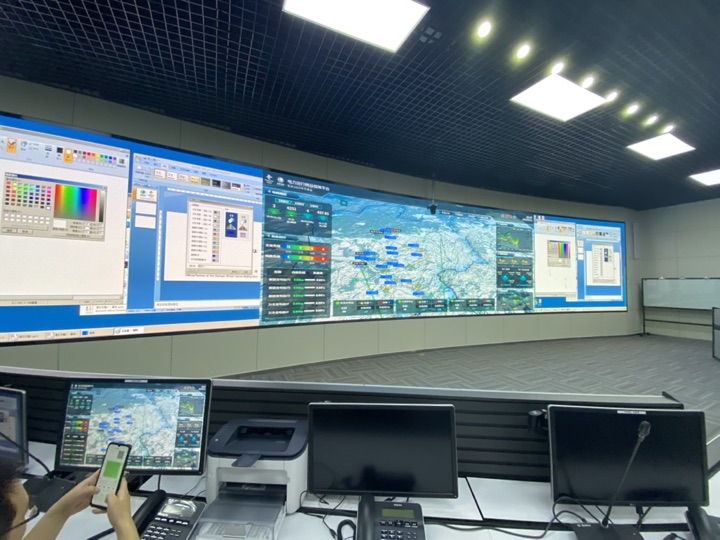
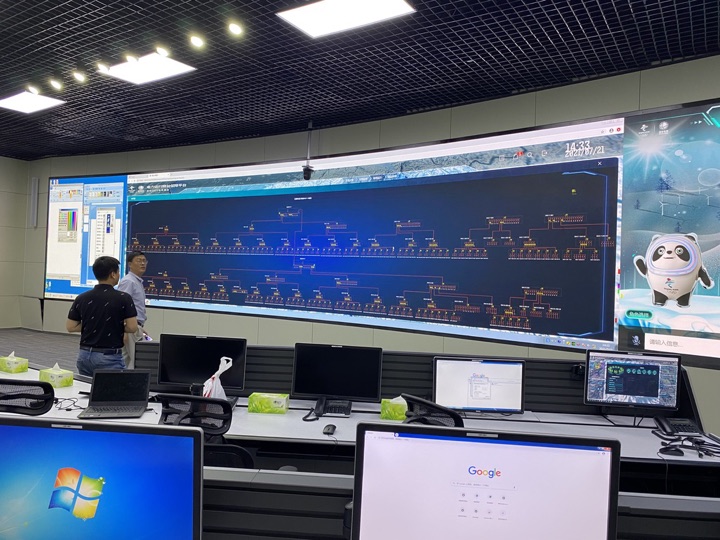
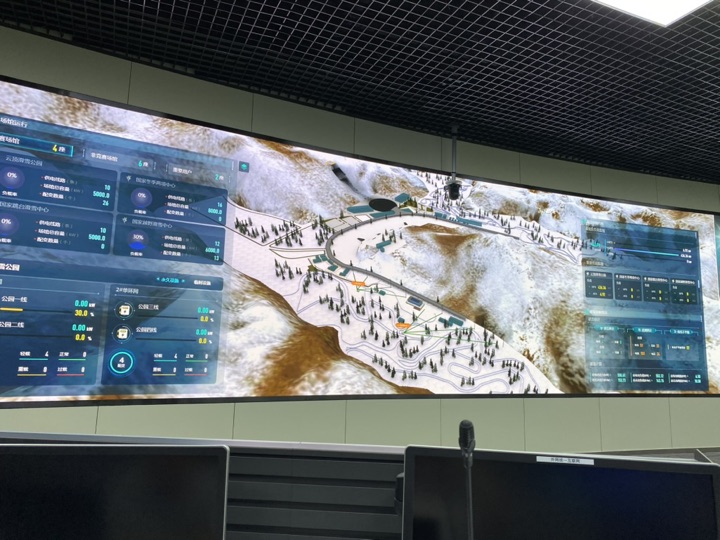
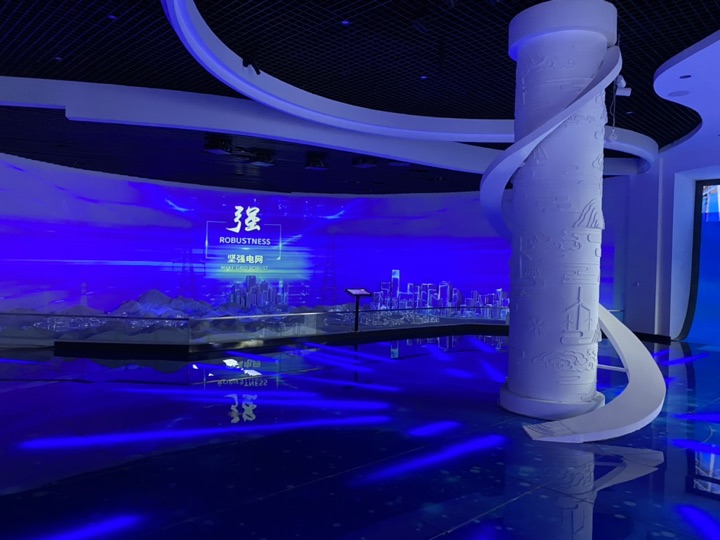
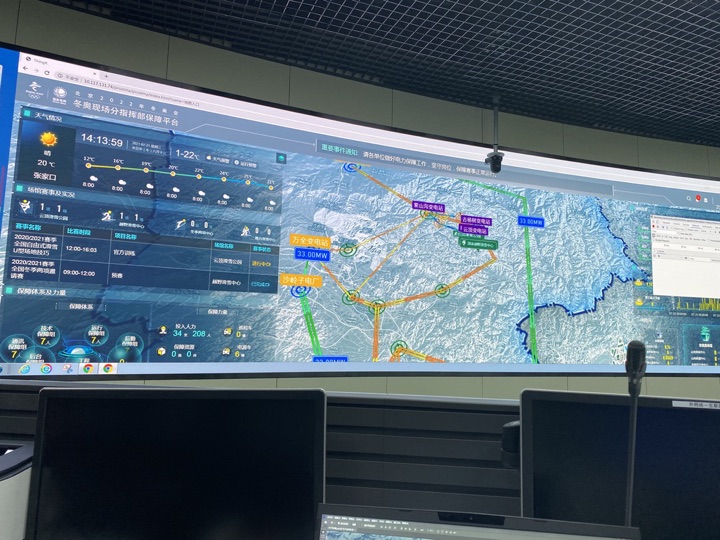
Command Center and Real Operating Environment
Field photos show the real deployment context: screen scale, viewing distance, command space, and multi-role collaboration.
- Design Output
- Large-Screen and Multi-Page Monitoring UI
- Operating Context
- Command Centers and On-Site Operations